
Hello! We are Debi Lang and Judy Savageau from the Center for Health Policy and Research at UMass Medical School. Earlier this year, Debi published a post on how program-specific learning objectives can help measure student learning to demonstrate program impact. Today’s post shows how to measure whether training or professional development programs are meeting learning objectives using a retrospective pre-post methodology.
Start at the End!
Using a traditional pre-and-then-post approach to measure student learning can suffer when students over or underestimate their knowledge/ability on the pre-test because we often “don’t know what we don’t know.” Therefore, the difference between pre and post-program data may inaccurately reflect the true impact of the program.
Instead of collecting data at the beginning and end of the program, the retrospective pre-post approach measures students’ learning only at the end by asking them to self-assess what they know from two viewpoints – BEFORE and AFTER participating. The responses can be compared to show changes in knowledge/skills.
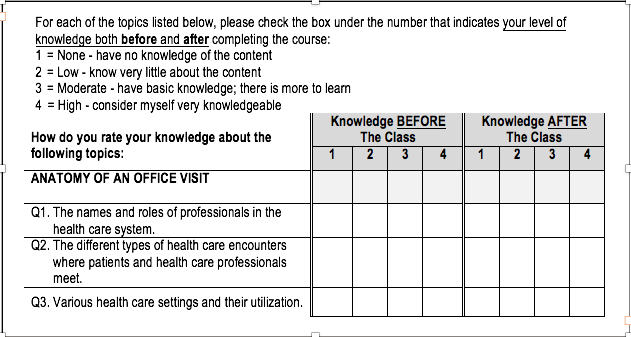
Below is an example of the retrospective pre-post design excerpted from the evaluation of a class on American Sign Language (ASL) interpreting in health care settings. Students are self-assessing their knowledge based on statements reflecting the learning objectives.
Hot Tips:
Here are some recommendations for designing a retrospective pre-post survey (as well as other training evaluation surveys):
- Write a brief statement at the top of the form stating the purpose of the evaluation along with general instructions on when, how and to whom to return completed forms, a confidentiality statement, and how responses will be used.
- Include space at the end to ask for comments on what worked and suggestions for improvement.
- Since many learners may not be familiar with the retrospective approach, use plain language so instructions are easily understood. This can be especially important for youth programs and when written or verbal instruction is not given in a student’s native language.
And Now for the Statistics…
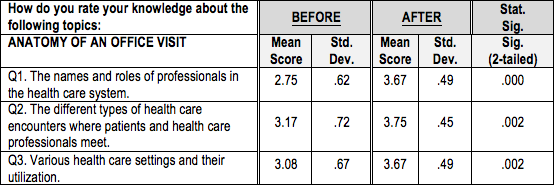
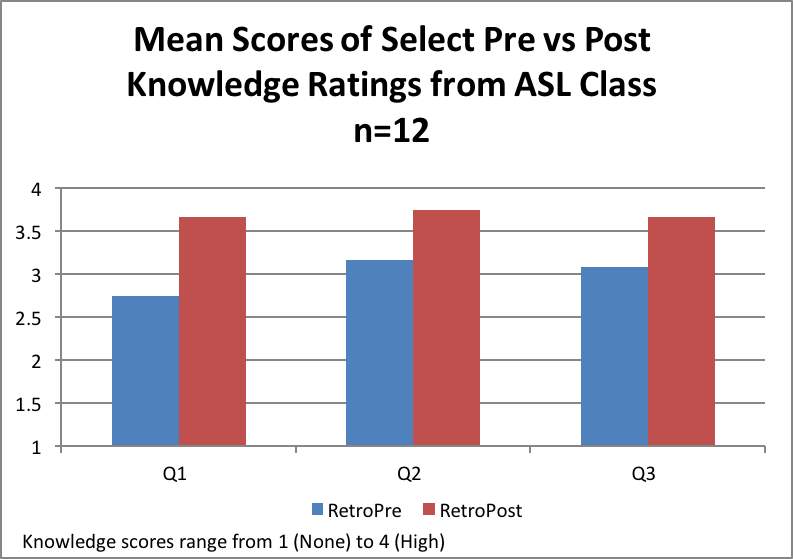
Generally, a simple paired t-test is used to compare mean pre and post scores. However, if sample sizes are too small such that the data are not normally distributed, the non-parametric equivalent of the paired t-test would typically be computed. To analyze the data from the ASL class, with a sample size of 12, we used the Wilcoxon signed-rank test. Below are the average class scores for the 3 measures.
Lessons Learned:
Using a retrospective pre-post design allows for analysis of anonymous paired data, whereas the traditional pre-post approach requires linking the paired data to each student, which may compromise anonymity.
If follow-up data is collected (e.g., 6 months post-training) to measure sustainability of knowledge, additional analytic testing would require a plan to merge the two data files by some type of ID number.
Rad Resources:
- What’s the Difference? “Post then Pre” & “Pre then Post”
- The Retrospective Pretest: An Imperfect but Useful Tool
- Synthesis of Literature Relative to the Retrospective Pretest Design
Do you have questions, concerns, kudos, or content to extend this aea365 contribution? Please add them in the comments section for this post on the aea365 webpage so that we may enrich our community of practice. Would you like to submit an aea365 Tip? Please send a note of interest to aea365@eval.org . aea365 is sponsored by the American Evaluation Association and provides a Tip-a-Day by and for evaluators.
Pingback: Reflections on Privilege When Working with Latin@ Communities: Perspectives from a Student Evaluator by Sarah Fleming · AEA365
My colleagues and I have been using a variation on this work. We call it a “decision making approach” in contrast to a “judgement making approach” and we describe it as a post-pre assessment. We draw a dividing line between the second and third check boxes. Then we start with the comment “Knowing what you know now about…”would you say it was OK (right hand side of the dividing line) or Not OK (the left side of the dividing line). Then for each item if it is on the left side of the dividing line, is it really terrible (=0) or not really acceptable, but almost there (=1), If the item is on the right hand side of the dividing line, is it minimally acceptable (but still OK otherwise it would be 0 or 1) (=2), is it really very good-exceptional (=4), or somewhere in between barely OK and exceptional (=3).
We have used this in a variety of settings: counsellor training, practicum evaluation, music education, peer coaching, course evaluations. When we approach this as a two-step process (1=OK or Not OK and 2=rate each item, and especially the part that states minimally, exceptional, or somewhere in between), we get exceptionally high inter-rater reliability, usually over 90%. In one trial we used a traditional pretest, and the post-pre assessment and we found that there were statistically significant differences between the pretest ratings and the “before” scores on the post-pre assessment.
So grateful for this post! It’s exactly what I’ve been struggling with this past week. The rad resources are incredibly helpful! Thank you.
The article notes that authors used the Wilcoxon signed-rank test, but the table provided looks at if it is the output for a paired t-test. Can you confirm which test results are being provided? Thank you!
As noted in the post, we had a relatively small sample, so often we use the non-parametric equivalent to the ‘standard’ tests that one might do with this type of data. I typically run both the paired t-test in this case as well as the Wilcoxon signed-rank test (for small N’s and non-normally distributed data; though it’s often harder for people to think about medians than comparing means) – but with some sample sizes, one might do both and confirm the results, then present means for ease of interpretation. That was what we did in this case.
Great posting! We use RPT very often when assessing participants’ perceptions of their learning or attitude changes.
We analyze data in a variety of ways. Yes, we do the paired t-test. We also look at the percent of participants who reflected that they already knew the “max” BEFORE training to see if the training was too easy or too difficult. We also look at “adjusted” change scores – normalized gain scores – to adjust for those who said they already new the max before training…since they have a ceiling effect and could not change.
What do you do with negative changes on the RPT? People who report knowing less after training than before?
Hi Melanie – Thanks for sharing how you deal with learners who rate their knowledge at the ‘max’ level on the BEFORE scale. When that does happen, are you able to determine why the person attended the training, or what they hoped to learn? How was the information about the training promoted? Did they attend because it was required, regardless of their prior knowledge of the content?
Our learner population varies in cultural background, education level, and literacy skills. The very few times I’ve seen a negative change from BEFORE to AFTER, I’ve wondered if it has to do with a learner not understanding how to respond to the RPT because the verbal or written instructions aren’t clear. (I’m generally not the one distributing and collecting the surveys.)
I love the authors’ points here about the added-value of a retrospective design, because we “often don’t know what we don’t know” – this is a great point that doesn’t get enough attention!
However, two of the statistical decisions above are a bit unorthodox. The first is calculating the mean for data that are derived from a Likert scale (and thus ordinal data) – the standard view in statistics is that median is the correct measure of central tendency for ordinal data, though this is a statistical rule that is often violated in practitioner (even peer-reviewed!) analysis.
The second has to do with whether the data being analyzed are sample or population data. Training data is often population (not sample), data; this is more detailed than the authors had space for, but if the data are population data, the analysis probably doesn’t really need inferential statistics at all.
I totally agree that with this type of training data, some statistical analyses can be an overkill – but it can be interesting to at least view some of the descriptive data at both points in time. Yes, it’s ordinal data (which some might used in a semi-continuous manner) which is why (plus the small sample size) that we did both the paired t-test as well as the non-parametric equivalent (the Wilcoxon signed rank test). We often do both and if no differences in interpretation exist, then presenting means is much easier for most non-statistical audience to grasp. Also, since this was a small part of the larger evaluation and not something being submitted to a peer-reviewed journal, we extended how we might look at ordinal data with a small sample. Your points are right on target; thanks!