
Hello! I’m Tony Fujs, Data Scientist at the World Bank. As many fellow data nerds, I love to visualize the data I have in my hands, but I also like to spend time visualizing data that I don’t have: Missing data.
Why would I do that? Because bad handling of missing data can seriously bias the results of a statistical analysis.
Hot Tip:
- Removing missing records from a dataset is generally not the right way to handle missing data!
- For more information about missing data, and techniques to address it, see:
In this post, I will present a common heatmap variation technique used to visualize missing data, and identify potentially harmful missingness patterns.
STEP 1: The data table
Here is a dataset containing fake education records. In this dataset, each row represents a unique student, and contains information about the following variables:
- Gender
- IQ scores
- Reading grades
- Math grades
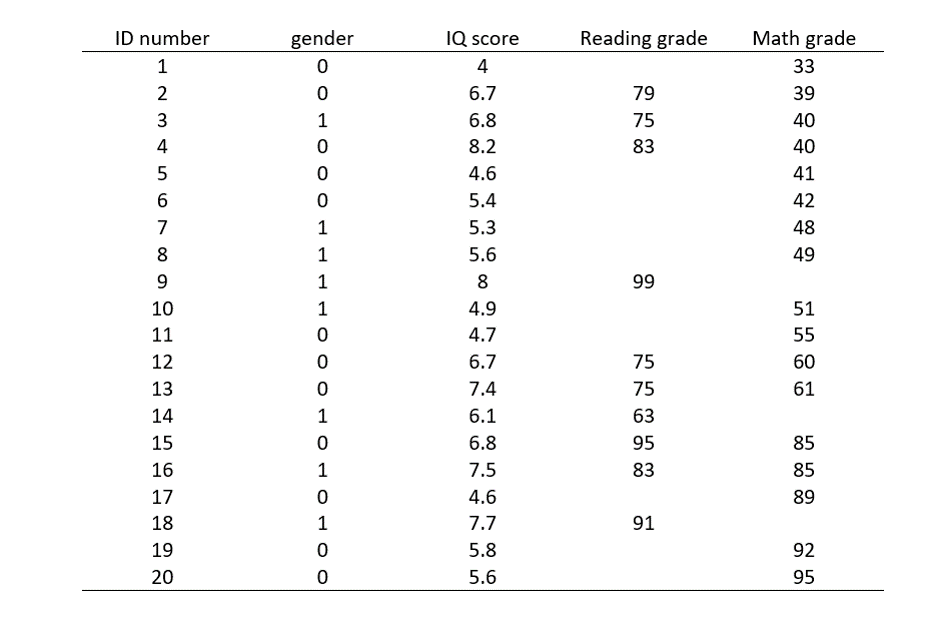
It’s relatively easy to spot missing data in this table, but I want to make the missing cells impossible to ignore. Let’s color each missing data cell in a bright, easy to spot color!
STEP 2: Choose a catchy color to highlight empty cells
Now, I really can’t ignore these empty cells, but I still can’t see – at least not easily – if there is any interesting pattern in the missing data.
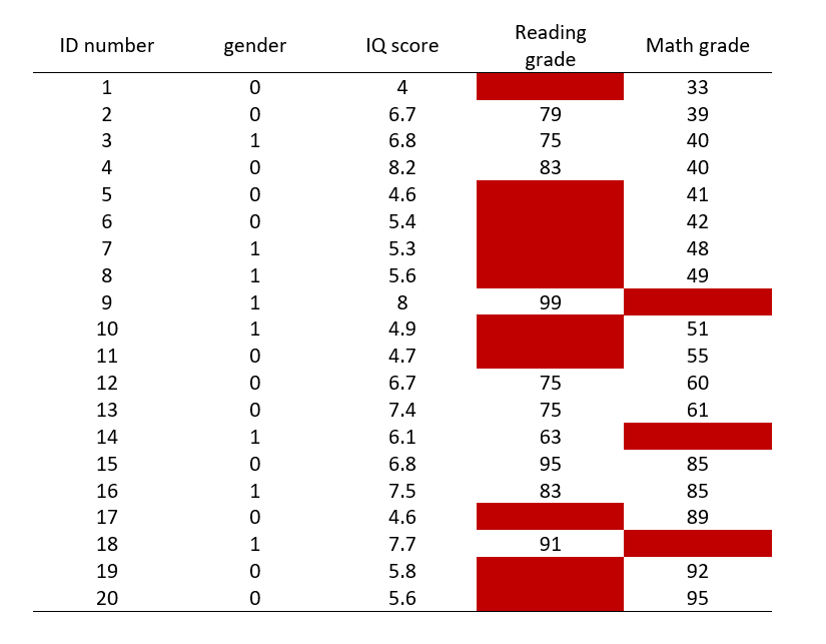
Next, I will use some heat map technique to colorize the non-missing cells of this table.
STEP 3: Color the non-empty cells according to their values
I will use a monochrome color scale. Since I am interested in comparing empty cells with non-empty cells, I want to keep the color scheme as simple as possible to facilitate this comparison. The shades of grey highlight the change in values of the non-empty cells, while maintaining a strong contrast with the red empty cells.
Low values are colored in light grey, while high values are colored in dark grey. Since we are only interested in checking missing data patterns, the actual values of the non-empty cells can be hidden.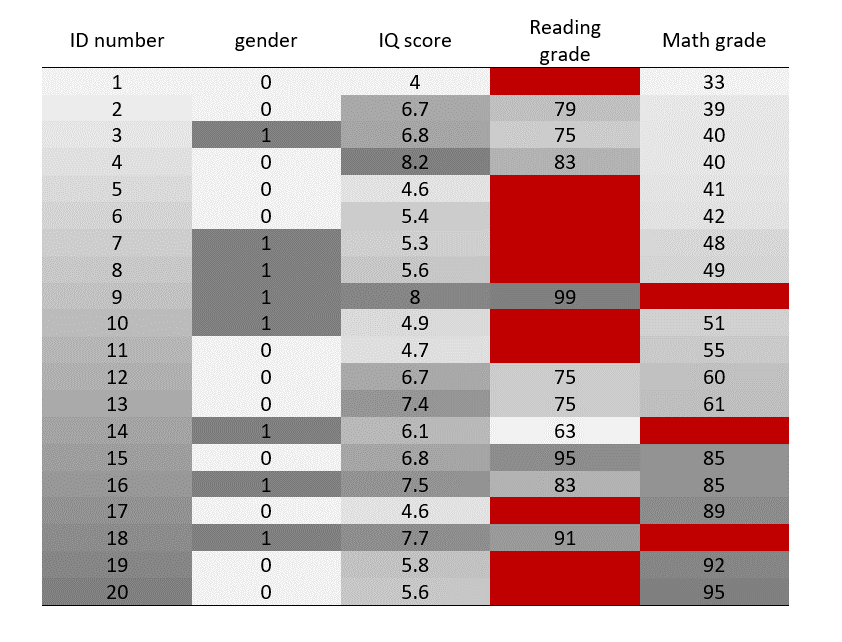
STEP 4: Remove the values
Some pattern now seems to emerge. But it is stillnot as obvious as it could be…
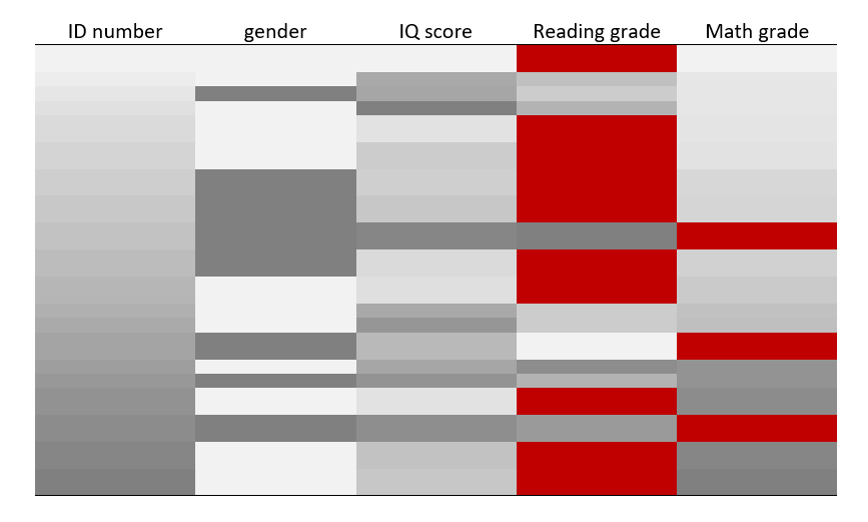
Let’s reorder the rows according to the values of the IQ scores columns.
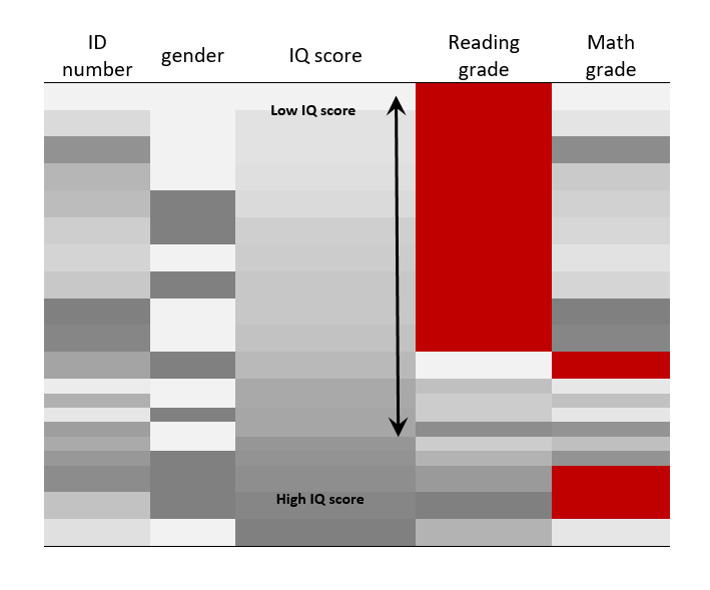
STEP 4: Sort columns values
It is now hard to miss the pattern of the missing data. Reading grades are missing for the lower half of the IQ score distribution… Assuming that a correlation exists between IQ scores and reading grades, removing the empty cells from the table would overestimate the average reading grade for this group of students.
Rad Resources:
- This visualization can be easily produced using the R package VIM:
http://www.statistik.tuwien.ac.at/forschung/CS/CS-2008-1complete.pdf
- It can also be done in Excel using a couple of hacks:
http://policyviz.com/create-a-heatmap-in-excel/
The American Evaluation Association is celebrating Data Visualization and Reporting (DVR) Week with our colleagues in the DVR Topical Interest Group. The contributions all this week to aea365 come from DVR TIG members. Do you have questions, concerns, kudos, or content to extend this aea365 contribution? Please add them in the comments section for this post on the aea365 webpage so that we may enrich our community of practice. Would you like to submit an aea365 Tip? Please send a note of interest to aea365@eval.org. aea365 is sponsored by the American Evaluation Association and provides a Tip-a-Day by and for evaluators.
Great post. We do not spend enough time discussing data issues like these. I liked the step by step approach and did not see the bias in the original set. Your tools truly allowed me to visualize the bias.
Great post – thank you. The article you linked to seems very comprehensive too.
Alicia