
Ann K. Emery and Denise Roosendaal here. We teamed up to produce a slide document about AEA’s vision for what the association could look like by 2020. Here’s a sneak peek of the fuller document, which will be released later this year.
Slide documents, or slidedocs, are slideshow-document hybrids. They’re designed inside presentation software like PowerPoint so that it’s easier to move text boxes, graphs, and diagrams around the page. But, unlike live presentations, slidedocs are intended to be read like regular reports. They contain full sentences, maybe even paragraphs, so that you can read the document without a presenter there to explain the content to you.
Here’s a preview of our slidedoc inside of PowerPoint. Can you spot the cover, the table of contents, and the introductory pages?
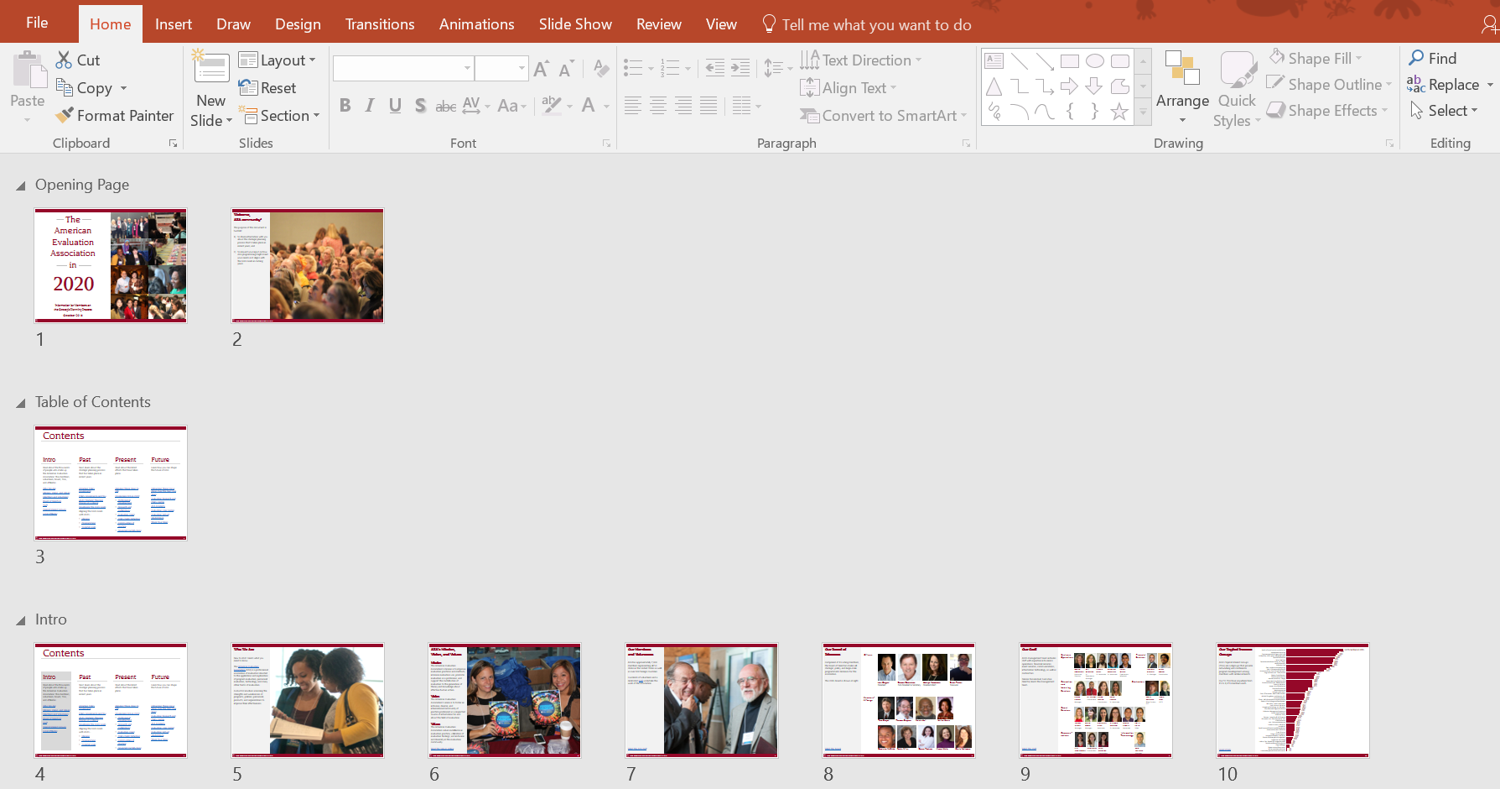
We used three data visualization and reporting techniques to reinforce AEA’s branding throughout the slidedoc: photos, fonts, and colors.
Photos of real-life AEA members brought the document to life more thana stock photographs ever could. We had several dozen photos of members from recent conferences (where members had signed photo releases). See any familiar faces?
 Fonts also reinforce branding. We used AEA’s font in the headings and subheadings. You can locate fonts inside an organization’s style guide. Or, use a free tool like www.whatthefont.com to find a close match.
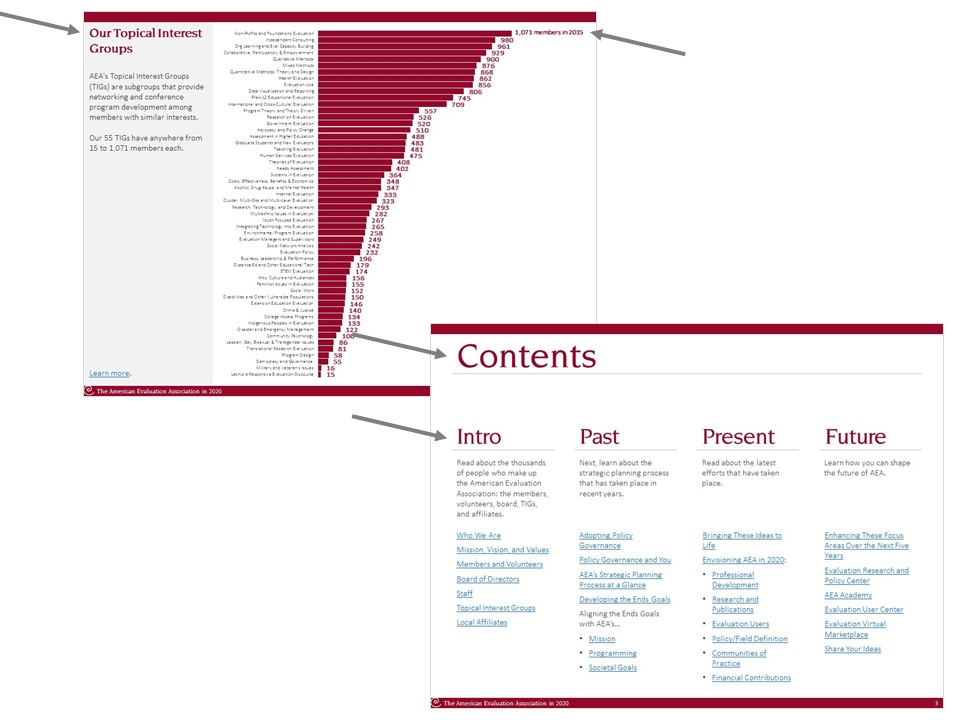
Color is probably the easiest way to reflect an organization’s branding. We used AEA’s RGB code—the amount of red, green, and blue that get mixed together to produce that distinct shade of burgundy. You can also locate color codes inside an organization’s style guide. Or, use a free tool like www.instant-eyedropper.com. If you’re using PowerPoint or Excel, just click on Shape Fill (the paint can), then select More Fill Colors, and then select Custom. You’ll type the three pieces of the RGB code inside this tab. We used AEA’s red across the bands at the top and bottom of the page, in the headings and subheadings, and in the graphs and diagrams like this one:
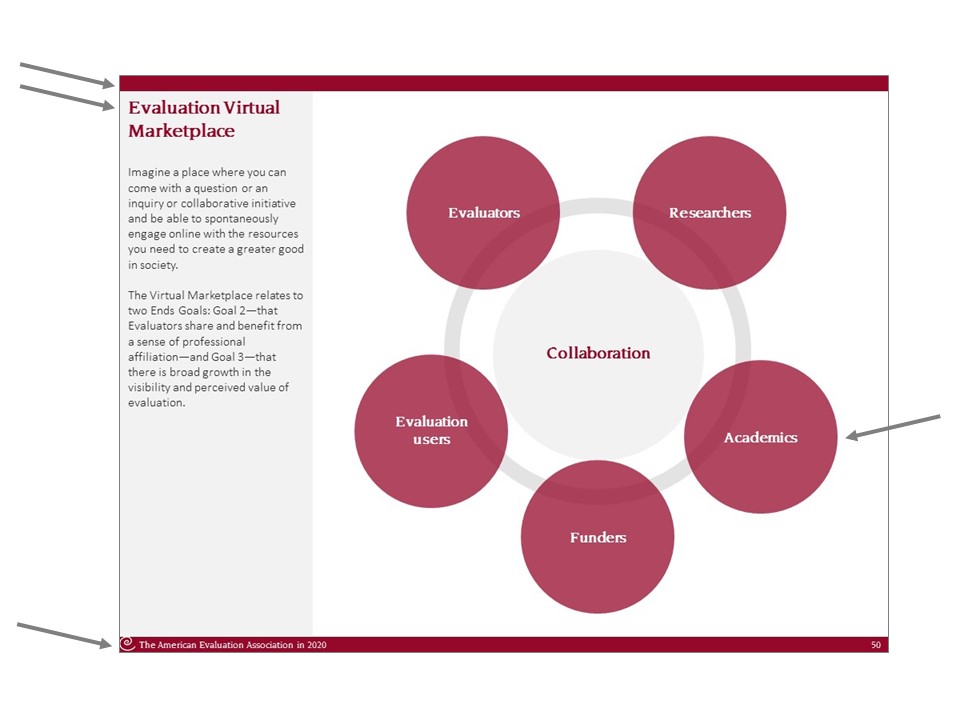
What we didn’t include: a huge logo. Thanks to the custom photos, fonts, and colors, we didn’t need to clutter our document with an oversized logo. AEA’s logo is there, but it’s tiny. We intentionally placed the logo at the bottom of the page, not at the top, so that it isn’t stealing valuable real estate away from our content.
We look forward to sharing the full slidedoc with you later this year!
The American Evaluation Association is celebrating Data Visualization and Reporting (DVR) Week with our colleagues in the DVR Topical Interest Group. The contributions all this week to aea365 come from DVR TIG members. Do you have questions, concerns, kudos, or content to extend this aea365 contribution? Please add them in the comments section for this post on the aea365 webpage so that we may enrich our community of practice. Would you like to submit an aea365 Tip? Please send a note of interest to aea365@eval.org. aea365 is sponsored by the American Evaluation Association and provides a Tip-a-Day by and for evaluators.