
Hello, so nice to virtually meet you! My name is Jill Brown (she/her) and I am a research and evaluation scientist with a passion for using data analysis and clear communication to inspire change. As evaluators, we both know how important it is to report clear and actionable findings. We want our stakeholders to use data to inform recommendations and improve programs. One path to clear communication is through quality data visualization, which requires successful execution of charts and graphs, an eye toward design, and content tailored to audiences. Enter the Data Visualization Society.
The Data Visualization Society, or DVS, is the global data visualization hub to connect you to resources, experts, and data while expanding your network and data visualization capacity. And it’s not just for members–there are resources for visualizers at all skill and contribution levels including how-to guides, robust conversation on important topics via Slack and fireside chats, and networking opportunities.
As one of our ongoing efforts, the DVS conducts an annual survey. Evaluators like you and I are often on both ends of the data collection experience, as survey designers and participants, but we often don’t know where the data end up. I can tell you that in the DVS survey the data are used in numerous ways and you, the data visualizer, benefit by participating!
First, the data can be used to inform how resources are tailored to the data visualization community. You can help by sharing what tools you use, what types of vizzes you’re creating, and your pain points during the visualization process. For example, a visualization using 2020 survey data allows you to explore what tools others use. With this knowledge you can head to the DVS Resources page or connect with others in the #topic-tools Slack channel.
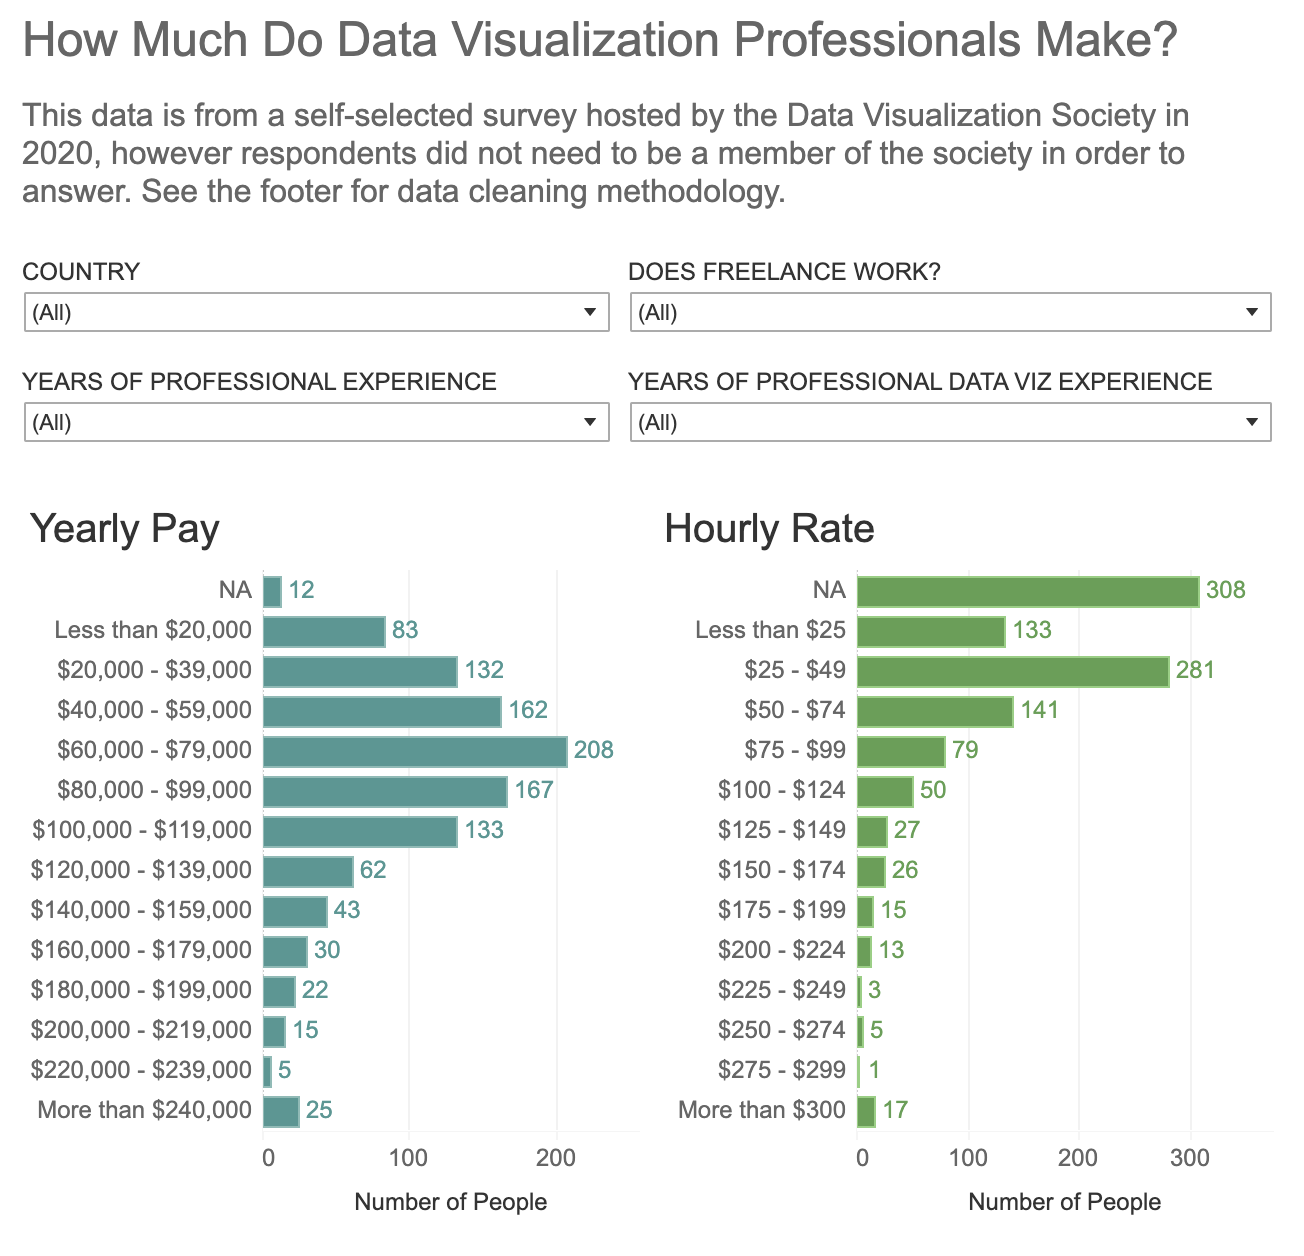
Second, the information you provide tells important stories. One story we heard from visualization designer Alli Torban in 2020 was about pay: 40% of freelancers in the U.S. reported charging $50-$100 an hour, while 10% said they charged $100-$125 an hour. Hourly rates were influenced more by total years of professional experience than years of data viz experience. These stories are critical for understanding and supporting data visualizers like yourself.
Third, we put the survey data in the hands of the practitioners. While the data may not be directly relevant to your work, sometimes it’s beneficial to practice visualizing or answer your own questions about data visualizers. When we publish the data, we simultaneously post a data visualization challenge, providing an opportunity for recognition as you explore, understand, play with, and visualize.
Finally, participating can be an opportunity to reflect on how you’re integrating data visualization into your workflow and the impact visualizations can have on the use of evaluation results.
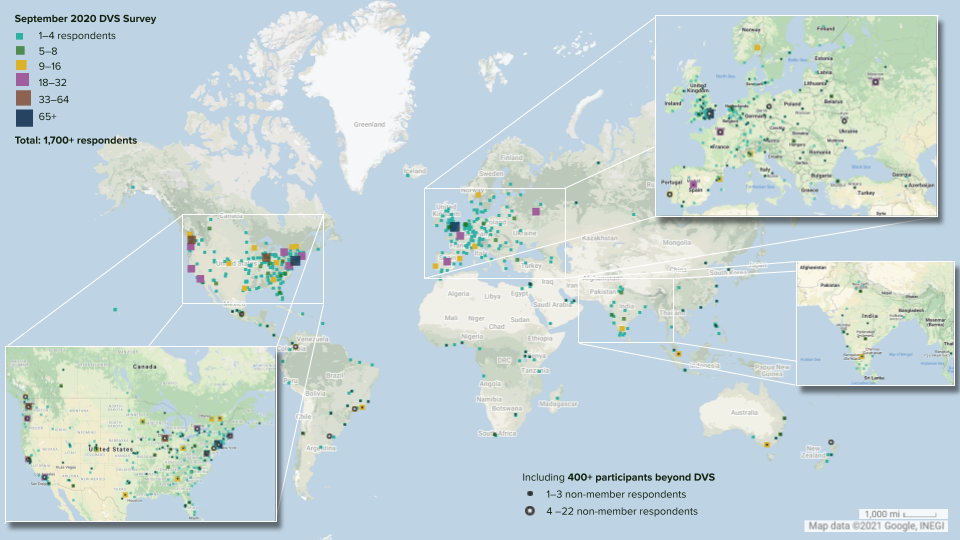
We haven’t reached everyone who might benefit from and enrich our DVS community–especially practitioners in adjacent fields like program evaluation. Our survey is currently one of the only resources that represents data visualizers worldwide and you can help us make it even more robust. The maps below by Josephine Dru show where 2020’s data visualizers are located–are you and your fellow evaluators represented?
Hot Tip:
Now all that’s left is for you to take the 2021 Data Visualization: State of the Industry survey. It goes live on September 1, so watch this space: https://www.datavisualizationsociety.org/survey.
As a thank you, everyone who takes the survey can get a discount on DVS swag and be entered into a drawing for other fun prizes, including a paid membership.
Do you have questions, concerns, kudos, or content to extend this aea365 contribution? Please add them in the comments section for this post on the aea365 webpage so that we may enrich our community of practice. Would you like to submit an aea365 Tip? Please send a note of interest to aea365@eval.org. aea365 is sponsored by the American Evaluation Association and provides a Tip-a-Day by and for evaluators. The views and opinions expressed on the AEA365 blog are solely those of the original authors and other contributors. These views and opinions do not necessarily represent those of the American Evaluation Association, and/or any/all contributors to this site.