
Hello, AEA365 community, and happy Conference Week from Indianapolis! The AEA staff have been working overtime to prepare for our biggest event of the year. Whether you will be joining us for the conference or not, you can keep up with our happenings via the AEA365 blog. See you around!
-Liz DiLuzio, Lead Curator
Hello! We are Isaac D. Castillo and Colleen Coyne, and we represent the Learning and Evaluation team at KABOOM!.
And we have a question for you:
What do playgrounds, data, systemic racism, maps, and evaluation all have in common?
Playgrounds should serve as a sanctuary for children – an escape from everyday pressures where they can just be kids. But not every child in the United States has access to a safe and high-quality playground.
At KABOOM!, we refer to these disparities in access and quality as playspace inequity. KABOOM! builds playgrounds in partnership with others across the United States to end playspace inequity, so more kids can grow up happy and healthy.
But how do we measure playspace inequity? That is where data, maps, storytelling, and evaluation come in.
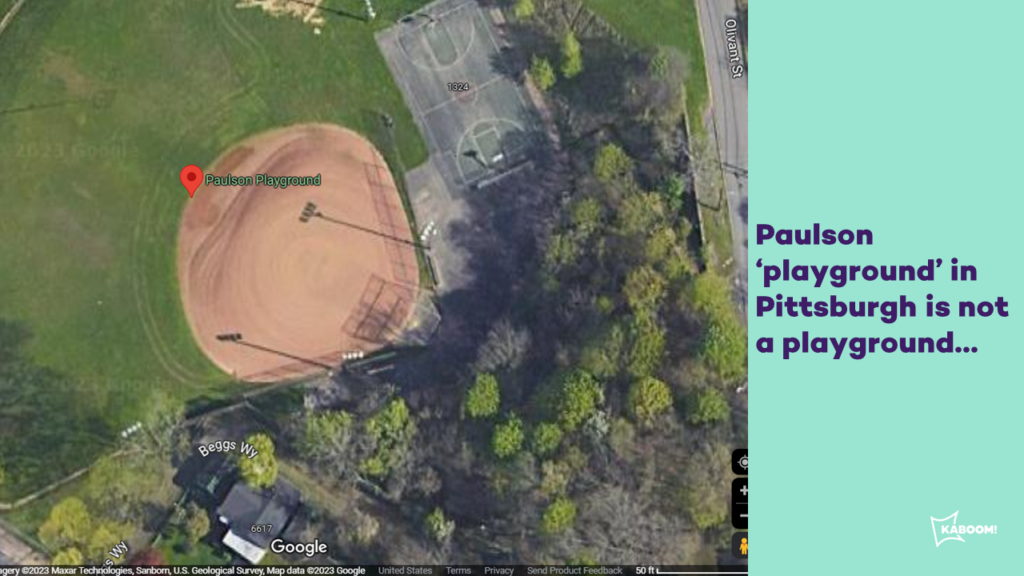
Most people assume that it’s easy to figure out where playgrounds are located. Unfortunately, most mapping software does not consistently verify playground locations. For example, this is NOT a playground.
Downloading this raw playground location data for the entire United States and cleaning it every year would take thousands of hours.
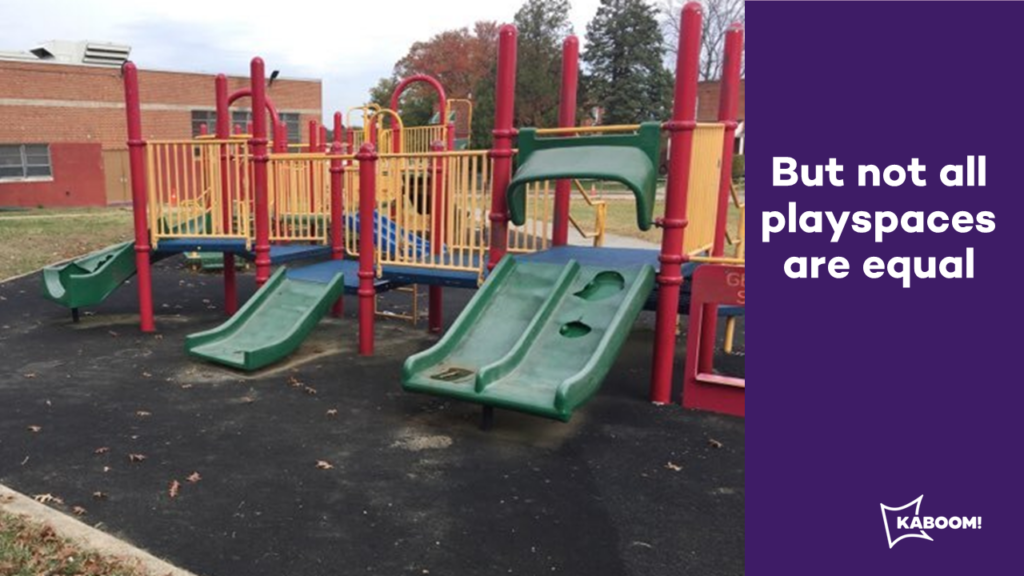
Furthermore, there is no national data set on playground quality. So even if we did know where playgrounds are located, we certainly do not know which ones are well maintained and which ones have broken swings and slides.
This is not a high-quality playground:
We know from prior research that there are more playground locations and more high-quality playgrounds in predominantly White wealthy neighborhoods. But without national data on playground locations and playground quality, it is difficult to prioritize communities for additional playground investments in a data-informed manner.
To help KABOOM! overcome this lack of data, we created the Playspace Inequity Prioritization Index (PIPI) which consists of 21 publicly available data points. These are standardized to create a single overall PIPI score for every census tract in the United States.
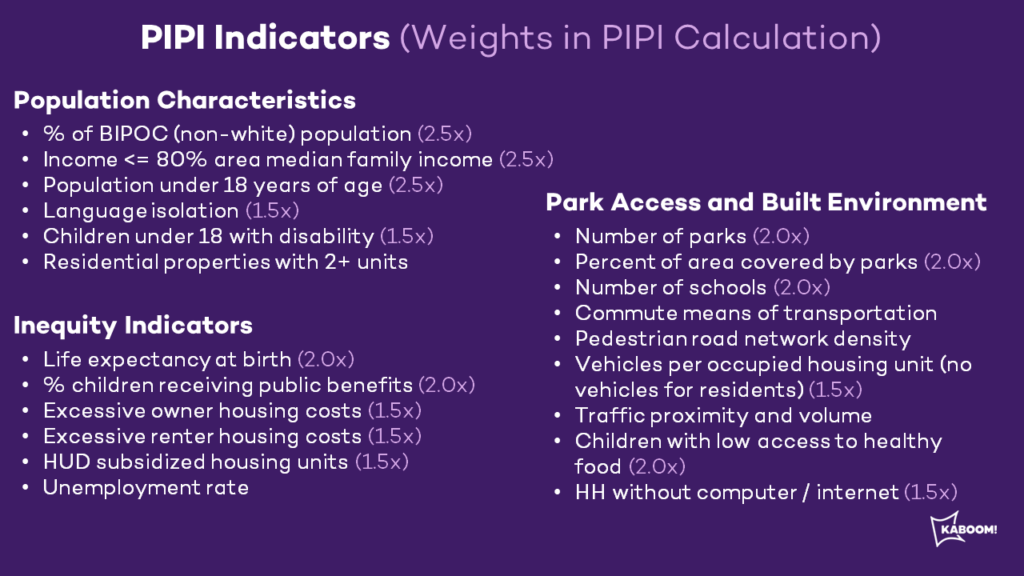
Many of these indicators reflect societal conditions rooted in systemic racism and intentional disinvestment. It was not that long ago that local governments chose to remove playgrounds entirely instead of allowing residents with different races, ethnicities, and income levels to play together in the same place.
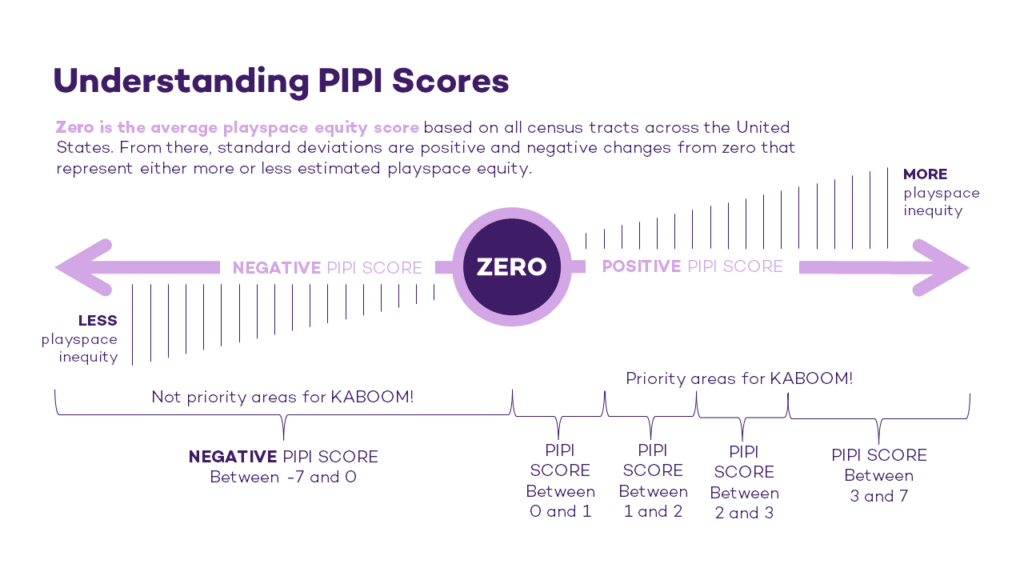
The overall PIPI score estimates where playspace inequity is likely to be occurring based on these indicators. With a higher positive (greater than zero) overall PIPI score reflecting greater playspace inequity and greater need for support from KABOOM!. While census tracts with negative (less than zero) overall PIPI scores reflecting communities experiencing less playspace inequity and that likely have been the beneficiaries of regular societal investments.
With PIPI scores for every census tract in the United States, we can create maps for every state, region, or city to help visually determine which areas are experiencing greater playspace inequity. These maps help us partner with parks and recreation departments, school systems, and other funders to prioritize new playground investments.
Using PIPI data, maps, and other data sets, we also work with partners to measure how our work changes playspace inequity over time.
Because playgrounds are fun – but figuring out where to build them is a serious endeavor.
Rad Resources
Mapping Playground Access in Philadelphia
The State of Playspace Equity in Three Colorado Communities
Review of Studies and Data on Playspace Equity for Children
Ending Playspace Inequities for Baltimore’s Kids
Do you have questions, concerns, kudos, or content to extend this aea365 contribution? Please add them in the comments section for this post on the aea365 webpage so that we may enrich our community of practice. Would you like to submit an aea365 Tip? Please send a note of interest to aea365@eval.org . aea365 is sponsored by the American Evaluation Association and provides a Tip-a-Day by and for evaluators. The views and opinions expressed on the AEA365 blog are solely those of the original authors and other contributors. These views and opinions do not necessarily represent those of the American Evaluation Association, and/or any/all contributors to this site.