
Hello! I am Vo Ram Yoon (he/him/his). I am a Data and Evaluation Consultant at the Mid-Atlantic Equity Consortium (MAEC), where I work on equity audits for public school districts and nonprofit organizations. As a queer, Korean Bolivian evaluator, I am a proponent for using quantitative and qualitative methods to honor the complex narratives and identities of minoritized communities. As a mixed methods tool, structural topic modeling (STM) can draw meaningful insights from vast amounts of qualitative data that would be overwhelming to code by hand.
Originating from natural language processing, topic modeling identifies patterns among words within a collection of documents in the assumption that different words are used to discuss different topics. Applying topic modeling to comments from students discussing their favorite school subjects would identify distinct words for describing the topic of “chemistry” in contrast to “music”. Topic modeling can answer the following questions:
- What topics are discussed in a collection of documents?
- What words are used within those topics?
- Which topics tend to be discussed more than others?
STM is a type of topic modeling that answers an additional question of high interest in the social sciences:
- How do the prevalence of topics and words within those topics differ by document covariates?
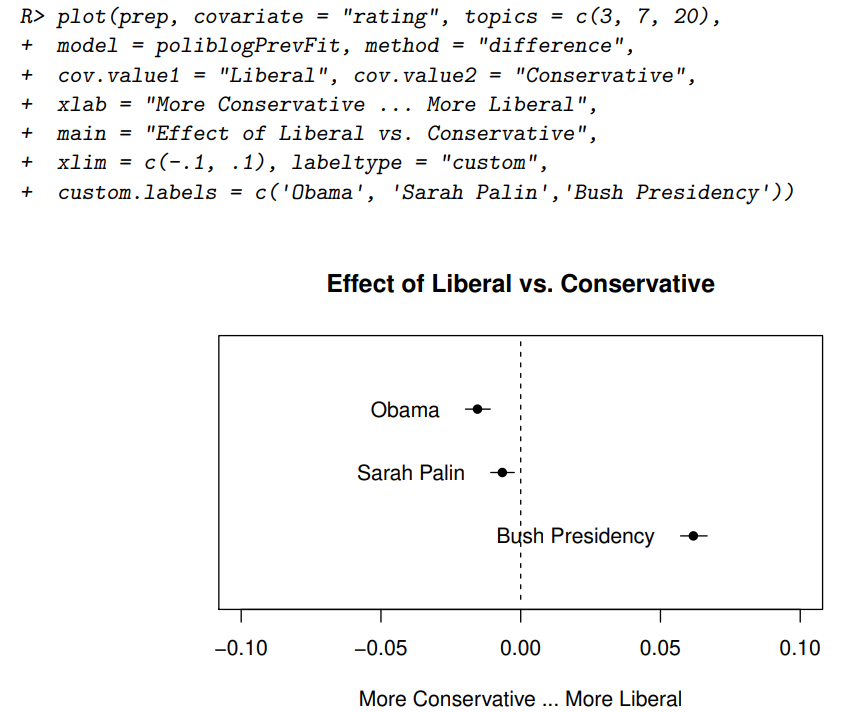
Such covariates can be the race, gender, or political affiliation of a respondent, which can produce nuanced analysis of differing attitudes on climate change and immigration. The following STM data visualizations using text from American politics blog posts demonstrate STM’s potential to draw concrete inferences from large qualitative datasets:
- Words highly associated with Topics 3, 7, and 20.

Based on the words with the highest probability of appearing within each topic, an evaluator could label Topic 3 as “Barack Obama”, Topic 7 as “Sarah Palin”, and “Topic 20” as the “Bush Presidency.”
- The proportion that each topic takes up across all blog posts

- The prevalence of Topics 3, 7, and 20 based on a blog’s political affiliation
What follows are steps I use in R to conduct STM.

STM is commonly applied through the stm package in R. Once you have loaded your data set, the textProcessor function offers key steps for processing data:
- removesstopwords = TRUE excludes words that are considered insignificant, such as conjunctions and articles, using built-in dictionaries in R.
- stem = TRUE transforms related words (e.g., educator, educating, educated, etc.) into their shared stem.
- wordLengths = c(3,Inf) excludes words that are less than three characters long.
- customstopwords enables one to add their own stopwords.

Afterwards, you can select a number of topics based on domain knowledge and quantitative metrics, such as exclusivity and semantic coherence. Setting K = 0 will make R automatically decide the number of topics.
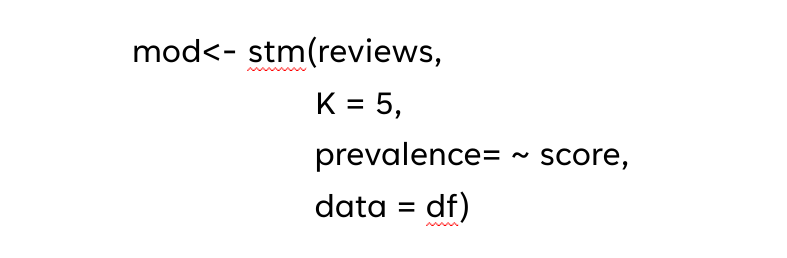
In this model, I am analyzing hundreds of reviews of program participants accounting for a continuous variable representing ratings while estimating five distinct topics.
While STM holds great promise in evaluation, it is informed by biased assumptions of which words are “meaningful” and interpretations of topics.
Hot Tips
- Provide nuanced within-group comparisons rather than monolithic between-group comparisons. A thoughtful approach to comparisons might uncover how opinions among members of a single racial group might differ by class status or political affiliation rather than generalizing the opinions of two racial groups.
- The lack of statistical significance does not invalidate lived experiences. Imposing quantitative standards to qualitative data can lead evaluators to neglect the voices of underrepresented groups, such as Indigenous peoples and Pacific Islanders.
Rad Resources
The American Evaluation Association is hostingIntegrating Technology into Evaluation TIG Week with our colleagues in the Integrating Technology into Evaluation Topical Interest Group. The contributions all this week to AEA365 come from ITE TIG members. Do you have questions, concerns, kudos, or content to extend this AEA365 contribution? Please add them in the comments section for this post on the AEA365 webpage so that we may enrich our community of practice. Would you like to submit an AEA365 Tip? Please send a note of interest to AEA365@eval.org. AEA365 is sponsored by the American Evaluation Association and provides a Tip-a-Day by and for evaluators. The views and opinions expressed on the AEA365 blog are solely those of the original authors and other contributors. These views and opinions do not necessarily represent those of the American Evaluation Association, and/or any/all contributors to this site.