
Hello, AEA365 community! Liz DiLuzio here, Lead Curator of the blog. This week is Individuals Week, which means we take a break from our themed weeks and spotlight the Hot Tips, Cool Tricks, Rad Resources and Lessons Learned from any evaluator interested in sharing. Would you like to contribute to future individuals weeks? Email me at AEA365@eval.org with an idea or a draft and we will make it happen.
I’m David Keyes and I run R for the Rest of Us. Over the years, I’ve helped hundreds of people learn R through courses and trainings. For a long time, I felt like I wasn’t a “real” R user. Real R users, in my mind, used R for hardcore stats. I “only” used R for descriptive stats. I sometimes felt like I was using a souped up sports car to drive 20 miles an hour to the grocery store. Eventually, I realized that this framing misses the point. R started out as a tool created by statisticians for other statisticians. But, over a quarter century since its creation, R is as much a tool to improve your workflow as it is a tool for statistics.
Let me give a few examples.
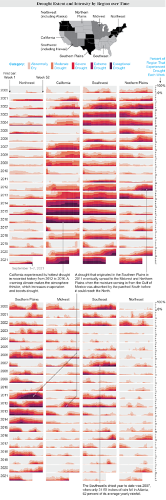
R is renowned as a tool to make high-quality data visualization. Below you can see an example chart made directly in R by two information designers (Cédric Scherer and Georgios Karamanis). You can find the R code here to apply these same principles of high-quality data visualization to make your own beautiful graphs.
R can also change how you do your reporting. It has a tool known as R Markdown, that allows you to go from data import to final report, all within R. Why use R Markdown? Well, let’s say your current workflow looks like this:
- Download your data from Google Sheets and import it into a statistical analysis tool like SPSS.
- Use SPSS to clean and analyze your data.
- Export summaries of your data as Excel spreadsheets.
- Use Excel to make some charts.
- Write your report in Word, pasting in your charts from Excel along the way.
But what happens when you realize you made a mistake along the way? Or you want to recreate the same report next month? You have to painstakingly retrace all of your steps. With R Markdown, you simply rerun your code and you’ll have a new report, complete with the most up-to-date data.
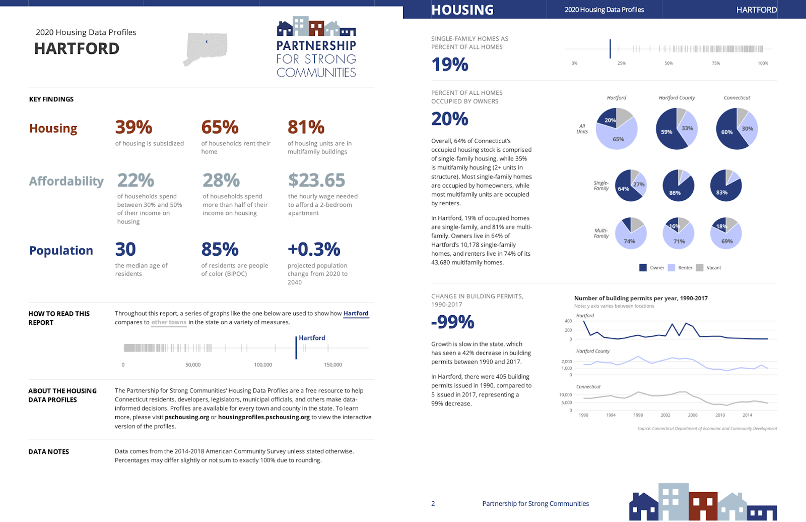
R Markdown opens up many possibilities, including what’s known as parameterized reporting. Say you’re doing a multi-site evaluation and need to produce reports for each school. Instead of making the reports manually, with R Markdown you can create a template and then use it to automatically generate dozens, hundreds, even thousands of reports. At R for the Rest of Us, we have used parameterized reporting to make many reports, including this one on housing and demographic data in Connecticut.
R can also help you to access data. Before switching to R, I used to spend hours downloading data from the U.S. Census Bureau website. Today, I use R to automatically connect to the Census Bureau datasets and bring in data directly to R using tools like tidycensus.
Rad Resource
These are just a few of the things you can do with R. If you’re interested in learning more about non-statistical applications of R, please check out my upcoming book R Without Statistics (which, by the way, I wrote using R). Why did I give it this provocative title? Because, while people think of R as a tool for statistics, it can do much more than stats, like the things I’ve laid out here. I think evaluators will get a lot out of R Without Statistics, which has a free online version. If you’re already an R user, the book will teach you some new things. And if you’ve never used R before, it will hopefully inspire you to consider learning it (there’s even an R programming crash course chapter).
Do you have questions, concerns, kudos, or content to extend this aea365 contribution? Please add them in the comments section for this post on the aea365 webpage so that we may enrich our community of practice. Would you like to submit an aea365 Tip? Please send a note of interest to aea365@eval.org . aea365 is sponsored by the American Evaluation Association and provides a Tip-a-Day by and for evaluators. The views and opinions expressed on the AEA365 blog are solely those of the original authors and other contributors. These views and opinions do not necessarily represent those of the American Evaluation Association, and/or any/all contributors to this site.