
Hi, we are Pei-Pei Lei and Carla Hillerns from the Office of Survey Research at the University of Massachusetts Medical School’s Center of Healthcare Policy and Research. The other day, we asked each other what one analysis tool is most vital to our quantitative survey work. We agreed on the answer – a banner table.
A banner table is a simple thing, really – just a set of crosstabs – but it’s so useful in analysis. For example, the table below shows how people of different ages and insurance types differ in their experiences with their doctors. By displaying all our key variables in one view, a banner table helps us to visualize stories from the data. It allows us to understand if subgroups of our respondents have different behaviors/opinions without having to run multiple analyses.
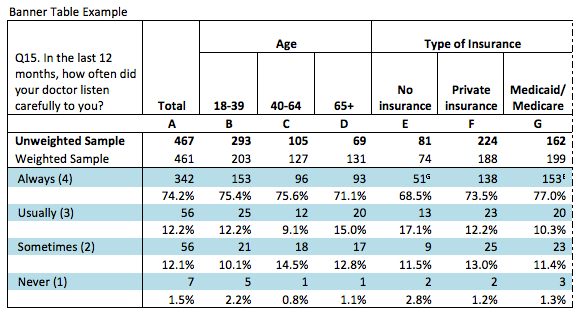
Hot Tip: We’ve used age and insurance type as our banner points in the table above. Both were collected as part of the same survey that asked respondents how often their doctors listened carefully to them. However, you can use multiple sources to create banner points, such as background data on the sample or previous waves of the survey.
Hot Tip: In setting up your tables, incorporate statistical test results so you can communicate statistically significant differences easily. In the above table, superscripts indicate statistically significant differences between banner points at the 95% confidence level.
Hot Tip: There are plenty of crosstab software packages that can create a large number of banner tables easily, but they usually come with a fee. If you have a limited budget or a small dataset, consider creating your banner tables through tools you already have. Here are a few software packages you might have and how you can create your banner tables with them:
- Excel: pivot table
- R: table function
- SAS: proc tabulate function
- SPSS: crosstabs comment
- STATA: table comment
Rad Resources:
- Want more information on banner tables? Check out these websites for more details and examples:
http://www.greenbook.org/marketing-research/anatomy-of-a-crosstab-03377
http://www.statpac.net/crosstabs-software.htm
- Are you a Qualtrics user? Here’s a helpful guide to creating crosstabs using your survey software:
- Are you a Confirmit user? Confirmit has a built-in tool, Instant Analytics, for creating banner tables:
Do you have questions, concerns, kudos, or content to extend this aea365 contribution? Please add them in the comments section for this post on the aea365 webpage so that we may enrich our community of practice. Would you like to submit an aea365 Tip? Please send a note of interest to aea365@eval.org . aea365 is sponsored by the American Evaluation Association and provides a Tip-a-Day by and for evaluators.