
Hello! Welcome to the Needs Assessment (NA) TIG Week on AEA365. As the AEA proposal process for the 2024 AEA conference in Portland is underway, the NA TIG invites you to submit a proposal, volunteer to be a proposal reviewer, or simply join our TIG in your AEA profile. Reach out to our TIG Chair Lisle Hites for more info.
Hi! My name is Madhawa “Mads” Palihapitiya. I am an evaluator, researcher, and lecturer at UMass Boston and the Principal Investigator on an evaluation of a set of mediation programs aiming to increase access to justice in Massachusetts. I’m sharing information on how to use Geographic Information Systems (GIS) in assessing needs and assets.
GIS are computer-based systems that allow users to collect, store, retrieve, analyze, and share geographically referenced data using maps, storymaps, statistical analysis, data dashboards and other ways of data analysis and visualization in ways that have greater impact on sponsors, funders, and communities.
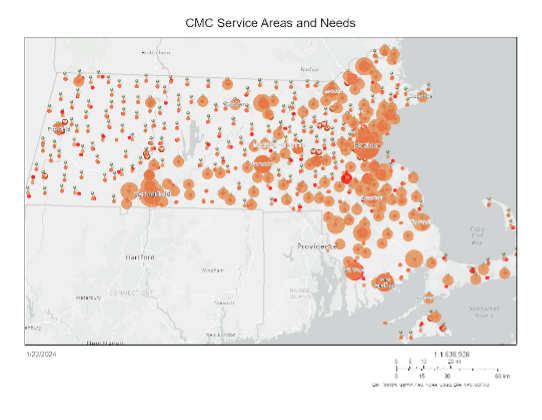
We started using GIS the Fall of 2023 to identify diversity, equity, inclusion, and housing needs to identify service gaps, areas of high needs (high rates of eviction, foreclosure, diversity, inequality) for purposes of investing in exiting community assets. We used primary data from a database, grant applications and survey data and used the addresses and zip codes to geolocate these services. It was then that we were able to identify geographic locations (cities and towns) currently not served by the dispute resolution programs, as in the figure, below.
Know your audience and who will be receiving any evaluation products such as toolkits, training materials, and reports that will disseminate evaluation findings. For example, the research team works with our communications department to create infographic visualizations for sections of data. In turn, these infographics can be shared on social media or embedded into reports and slide decks.
Hot Tip
Make sure to collect at least the zip codes, if not the full address – and use a free service like https://www.geoapify.com to geolocate (latitude and longitude) of your dataset. If you are affiliated to a university or research group, talk to them about obtaining a GIS license or training on how to use ESRI’s ArcGIS.
Lessons Learned
In most cases, we collect survey and interview data, or draw on existing datasets without much thought on collecting, storing, and analyzing that data based on geographic locations and attending attributes like poverty, homelessness, health, and justice indicators in those locations making our analysis and presentation of data incomplete.
Data speaks a thousand words if represented visually. The same is true with GIS, which allows you to overlay your own data with data from a service like the Living Atlas, ArcGIS Server, federal, state, and local government organizations like HUD and the U.S. Census Bureau, universities, and researchers and generally, most geolocated publicly available data and compare that data with your own data visually using hot spots, timeseries or other more complex analysis. In general, we found that GIS is an excellent and spatially and temporally representing needs/gaps alongside assets.
Rad Resources
1. Interested in spatial statistics? See the Spatial Statistics Toolbox to learn more.
2. Check out these opensource GIS tools.
3. GIS have been used widely in evaluating public health programs, but their applicability can be much broader than that. If you cannot afford a license for Esri’s ArcGIS, free or low-cost GIS tools do exist, though with some limitations. Examples include QGis and a host of other free opensource GIS tools.
The American Evaluation Association is hosting Needs Assessment (NA) TIG Week with our colleagues in the Needs Assessment Topical Interest Group. The contributions all this week to AEA365 come from our NA TIG members. Do you have questions, concerns, kudos, or content to extend this AEA365 contribution? Please add them in the comments section for this post on the AEA365 webpage so that we may enrich our community of practice. Would you like to submit an AEA365 Tip? Please send a note of interest to AEA365@eval.org. AEA365 is sponsored by the American Evaluation Association and provides a Tip-a-Day by and for evaluators. The views and opinions expressed on the AEA365 blog are solely those of the original authors and other contributors. These views and opinions do not necessarily represent those of the American Evaluation Association, and/or any/all contributors to this site.