We are Lisa Holliday and Olivia Stevenson. We are data architects with The Evaluation Group where we have recently begun to transition to R for data analysis. R is a free program for statistical analysis that is powerful, but can have a steep learning curve if you want to utilize its scripting capabilities.
Is R worth it for evaluators?
In short, yes! R makes advanced analyses, such as propensity score models, social network analyses, and hierarchical linear models possible with just a few lines of code. R opens possibilities with data visualizations that are highly customizable while maintaining fast reproducibility. R is an essential tool for all evaluators especially as the demand on evaluators for more rigorous designs and analyses continue to grow.
Where can I start?
The Rcmdr package offers a point and click interface that makes R much more user-friendly. Not only is it easy to install, but it also generates R scripts, which can be saved, modified, and re-run. This can be a big time-saver!
Cool Trick 1: The Latest Version of R
To get started, you will need to install the latest version of R, which can be found here. The most recently released version will appear in the “News” feed. You should also install RStudio Desktop. RStudio is an integrated development environment (IDE) that makes working with R and installing R packages quick and easy. When you want to use R, open RStudio to get started.
Cool Trick 2: Installing Rcmdr
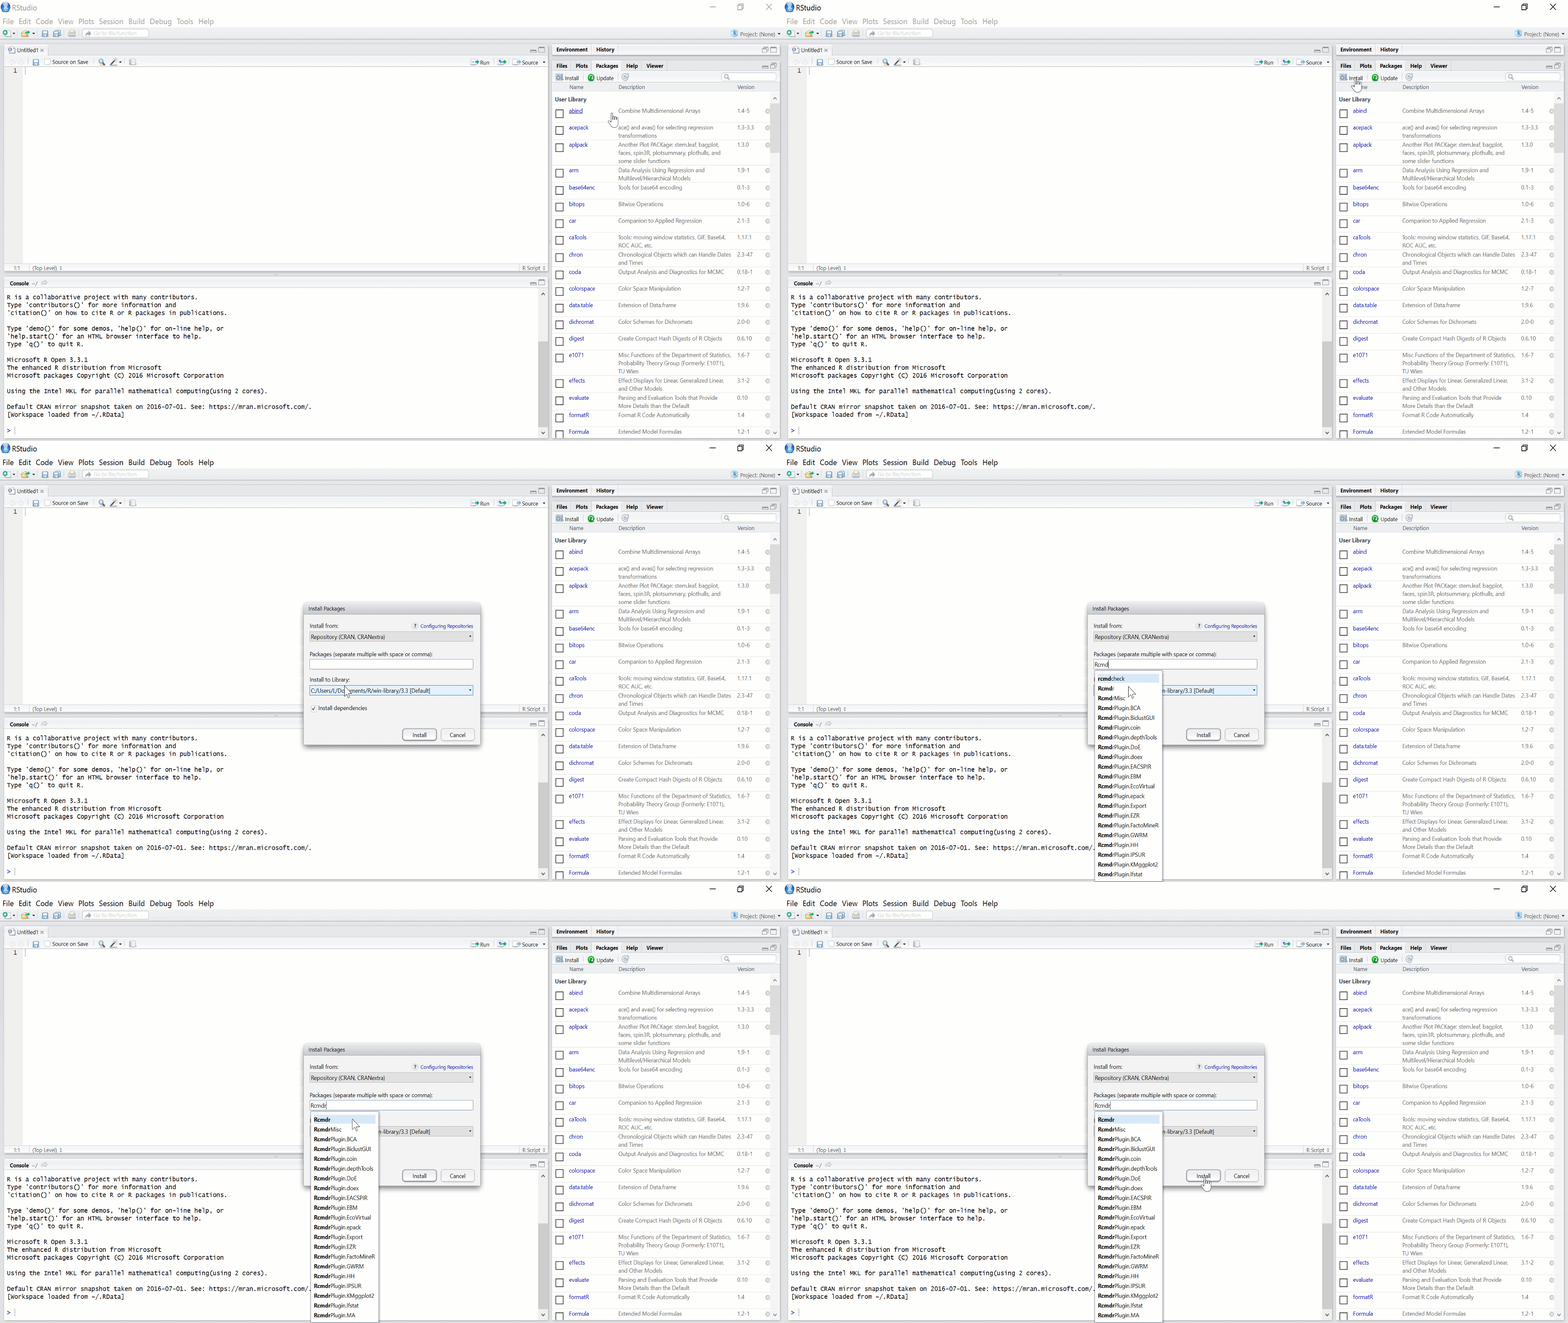
Within RStudio, select “Install” from the “Packages” pane in the lower right hand corner of your screen. In the pop-up window, enter “Rcmdr” and select “Install.”
(*click on image to see larger)
Cool Trick 3: Using Rcmdr
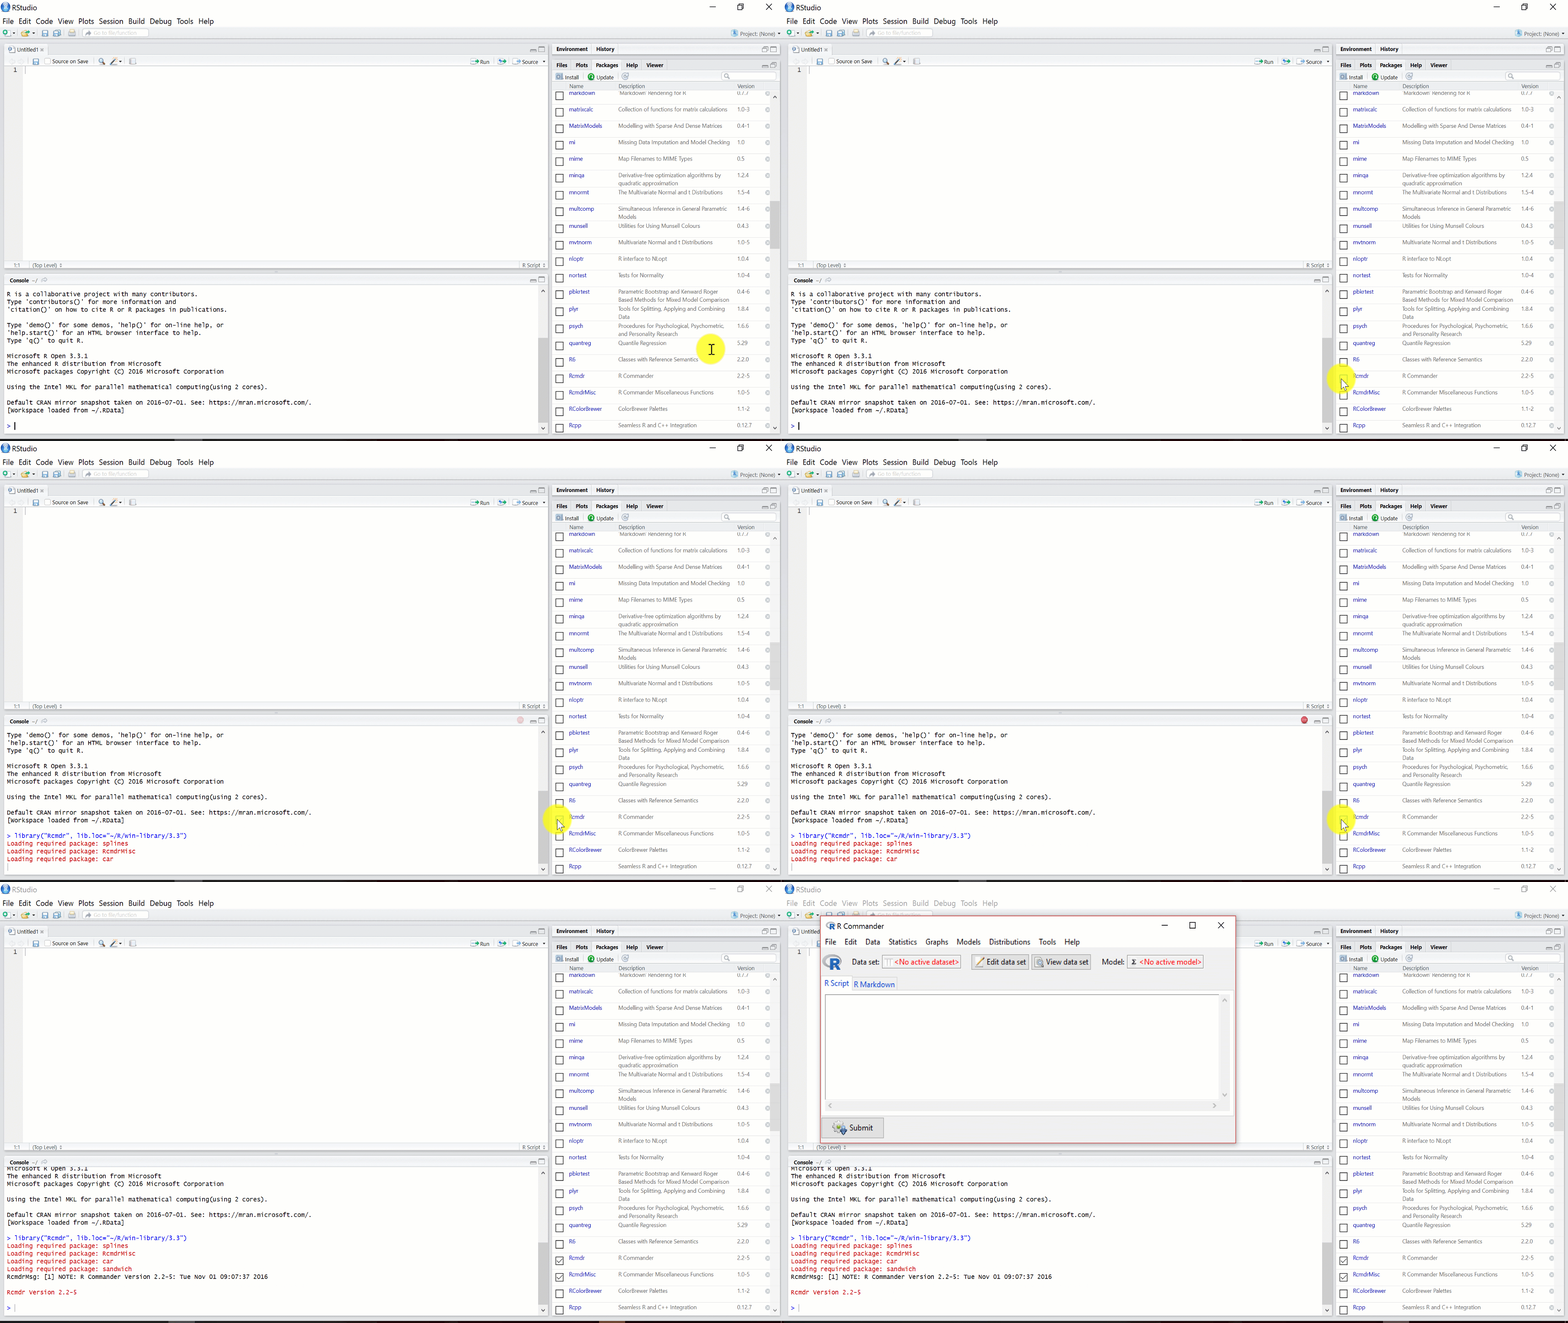
Once you have installed Rcmdr, all you will need to do is select it from the “Packages” pane. While it will open automatically, the first time you use it, you may receive a message that you need to download additional packages. If this happens, approve the installations, and Rcmdr will open in a new window when this process is complete.
(*click on image to see larger)
Rad Resources: Rcmdr Training
There are a lot of great resources available on how to get started with Rcmdr. Here is a brief introduction to Rcmdr that includes how to import data. A good introduction to using RStudio (and R in general) is Lynda’s “Getting Started with the R Environment,” which you may be able to view for free through your public library.
Do you have questions, concerns, kudos, or content to extend this aea365 contribution? Please add them in the comments section for this post on the aea365 webpage so that we may enrich our community of practice. Would you like to submit an aea365 Tip? Please send a note of interest to aea365@eval.org . aea365 is sponsored by the American Evaluation Association and provides a Tip-a-Day by and for evaluators.


Hi Paul,
Thanks for reading! To answer your questions:
1) Ggplot2 and dplyr are great for data visualization and data manipulation! Here are a few more that we have found useful in our evaluation work:
psych: a hodgepodge of helpful tools including psychometric analyses.
plotly: similar to ggplot2 this is another great package for data viz.
rcolorbrewer: great for customizing color in your reports.
pwr: power analysis tools.
matchit: matching package that allows for quickly matching a treatment and control group in your designs.
2) The gifs were inserted using Camtasia and we are glad you found them helpful!
Best,
Lisa and Olivia
Lisa and Olivia,
Thank you for this post! I’ve been using R for data analysis for the last year so the tool is relatively new to me. Two questions: 1) what are some of the other packages for R that you’d suggest evaluators become familiar with? I’m learning GGplot2 and Dplyr but am happy to add others to my list. 2) How did you insert the screenshot video tutorials (are they gifs?) in this post? They’re very helpful!
Warmly,
Paul Collier