

Hi, I’m Scott Vollmer, VP of STEM Learning at Great Lakes Science Center (GLSC) in Cleveland, Ohio. I am passionate about my work and find that evaluation data is especially useful when trying to express my passion objectively.
Since July 2017, we have been using COVES (the Collaboration for Ongoing Visitor Experience Studies) to collect and analyze audience-level data to enhance the guest experience. We have collected 858 surveys through the first year. One of the measurements included in COVES’ five-minute voluntary exit survey is the widely-used loyalty indicator known as Net Promoter Score® (NPS). Further, COVES collects data based on motivation, visitation trends, and guest demographics.
The data-parsing tools available through COVES are extensive and we stick to our five-year Strategic Plan while interpreting our results. Goals three and five of our Strategic Plan focus on investing in the guest experience of our target audience, and encourage return/frequent visits.
Sticking to the Strategic Plan ensures that we maximize our Return On Investment (ROI) when making improvements. The clearest example of this so far can be seen when looking at the NPS attached to our target demographic experience. Our core audience is families with children between the ages of two and twelve. When we look at only that demographic, our NPS is in the low 70s. This is exactly where we want to be, overall. When looking at adults without children, our NPS ranges from an abysmal 16 and only makes it as high as 57.5. This proves that we will see a greater ROI when focusing on our core audience. With COVES, we also have the luxury of diving deeper into exhibit-specific experiences. We have learned that our time and money is best spent on guest/staff interactions (exhibit interpretation, big shows, cart activities, etc.). Finally, we are able to track ROI results from our multi-day, Value-Added Programs. These Programs require doubling engagement staff and significant investments in immersive environments. Once these events are complete, we are able to see if there was improvement in the guest experience, allowing us to choose whether or not to make that investment again in the future.
Hot Tip:
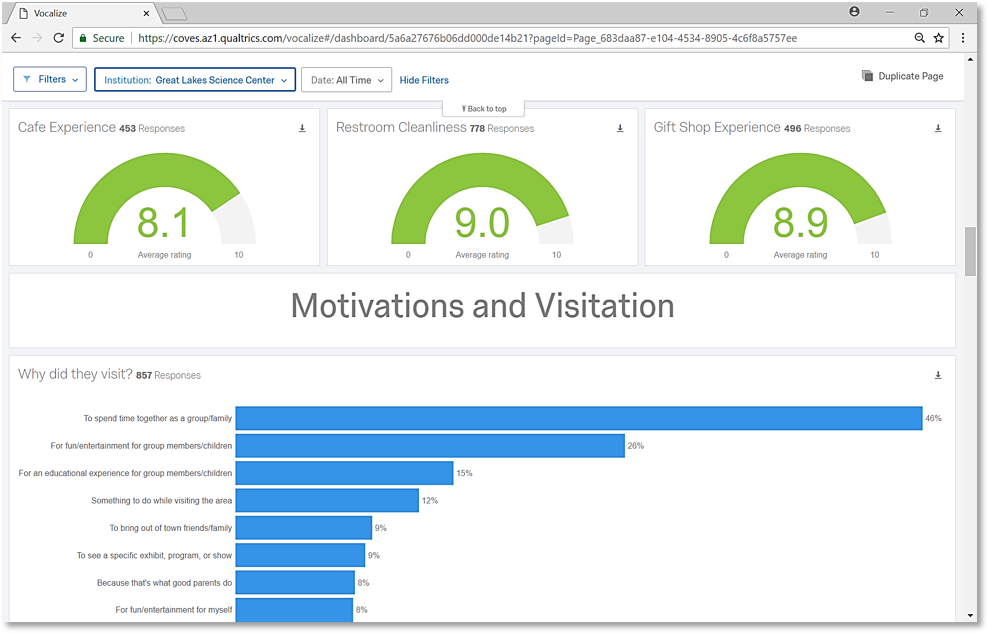
COVES is also a great tool for reporting out to our Board of Directors. We have created custom online dashboards using COVES data that are presented alongside more traditional Profit and Loss, Daily Gate Attendance, and Revenue reports. Rather than forcing arbitrary engagement goals, we use national aggregate COVES data to set benchmarks that our Board can easily understand. The ability to segment national data from similar medium-sized institutions allows us to have an apples-to-apples comparison.
The Great Lakes Science Center plans to continue using COVES to drive many of our decisions regarding exhibits, live interactions, events, traffic flow, and overall guest experience. We are certain that we can continue to build on past successes and spot negative trends before it is too late to make a difference.
We’re looking forward to the fall and the Evaluation 2018 conference all this week with our colleagues in the Local Arrangements Working Group (LAWG). Do you have questions, concerns, kudos, or content to extend this aea365 contribution? Please add them in the comments section for this post on the aea365 webpage so that we may enrich our community of practice. Would you like to contribute to aea365? Review the contribution guidelines and send your draft post to aea365@eval.org.