

I am Katie Butler, a 20+ year evaluator of environmental programs. I used to be a director in the EPA’s Office of Inspector General. Now, I run the GeoLiteracy Project, a small consulting company dedicated to improving environmental programs. I’m writing today to invite all of you to consider how the lens of geography can help you regardless of the subject of your evaluation.
Geographic information systems (GIS) allow us to view our work and analyses through a spatial lens. I generally focus on environmental programs, and so it is easy to see how geographic information applies to my work (shout out to the Environmental Program Evaluation TIG!). I need geographic information to understand an environmental initiative, or to draw the tricky end-outcome connections between program activities and improving the planet. But GIS is not just for those who know how to use GIS like me; GIS concepts allow evaluators in any discipline to view subjects and results differently. Let’s think about GIS through three geographic concepts: scale, proximity, and clustering.
Scale
Changing scale shows us that things are not what they initially seem. Images from the James Webb Space Telescope have shown us that if we can change out our space glasses (telescope lenses and focal distances), entire universes appear. When we look at a program or a concept at one scale, say state by state, we may notice particular patterns of interest. But when we can visualize information at a finer scale, say the county scale, entirely new observations may appear. GIS enables us to quickly move between scales, uncovering valuable findings across geographic boundaries as well as within them.
Proximity and Distance
Proximity metrics in a GIS help show how programs affect beneficiaries nearby and at distance. They help us show where and to what extent program impacts occur. In one project, we are studying whether community organizations reduce criminal activity. Geographic analysis will show us how the effects we observe wane with distance from the community organization’s buildings or activities. This information can help the community organization learn where to open new locations, what programs have the widest impacts, and show their sphere of influence to funders and the community.
Clustering and Hot Spots
GIS techniques show us how results group together or are dispersed geographically. They tell us where program results occur differentially across a landscape. Clusters of behavior changes could show us where an idea is catching on and spreading. On the other hand, clusters of concerns, like environmental dumping, criminal activity, or adverse health effects, can help an organization better identify areas in need.
Hot Tips
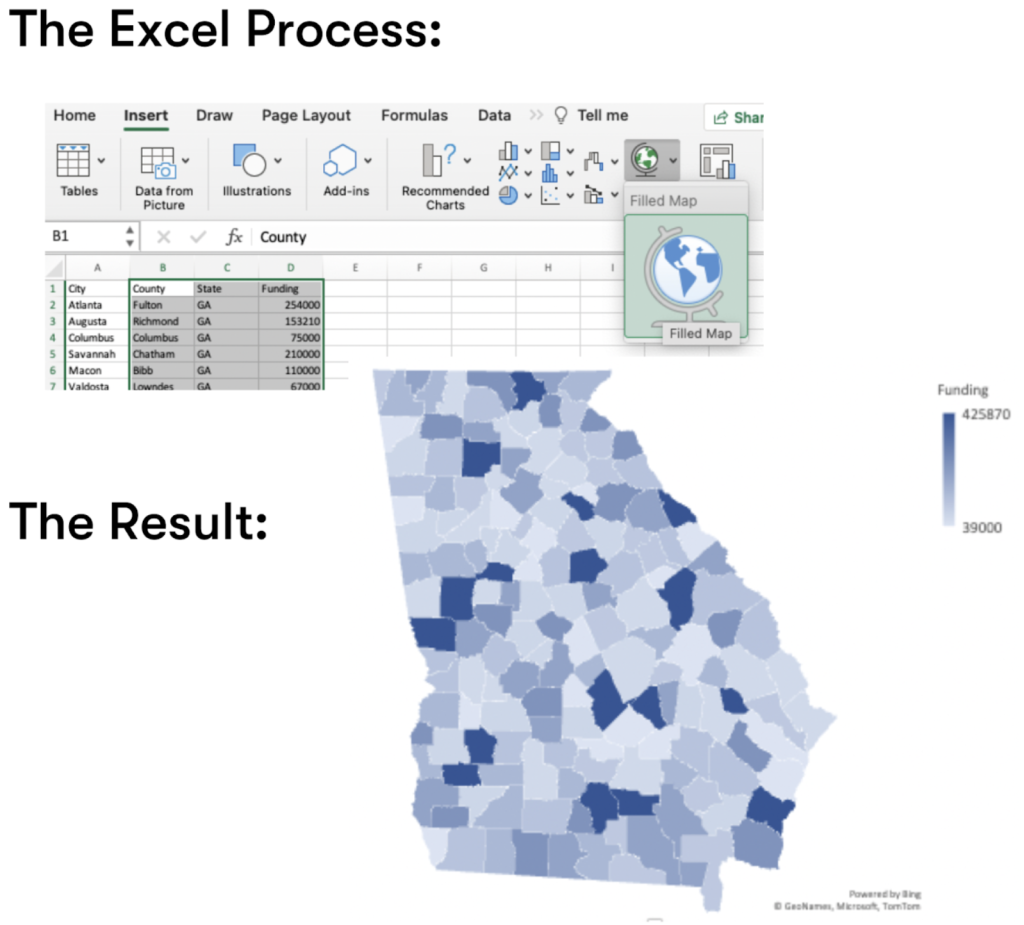
- Visualizing results on a map has become easier recently, with Microsoft Excel adding a basic mapping function. Tableau also offers some basic mapping capabilities. If your data already exists in one of these tools, why not explore how your information may look presented in a map? As long as your data are presented using some of the most typical groupings (counties, states, countries–it doesn’t like cities very well), you can instantly map information right in the program.
- AEA includes a number of GIS-capable individuals (including yours truly). Reach out to me if you would like to explore incorporating GIS into your evaluation process, and we’ll find you someone with the know-how to help you.
- Attend our session at AEA on Friday morning, November 11th, to see a demo of some tools and resources, and learn more about how to develop your own maps.
If you do decide to incorporate some GIS into your work, will you let me know? I’d love to hear about it! katie@geoliteracyproject.com.
The American Evaluation Association is hosting Integrating Technology into Evaluation Topical Interest Group (ITE TIG) Week. The contributions all this week to AEA365 come from the ITE TIG members. Do you have questions, concerns, kudos, or content to extend this AEA365 contribution? Please add them in the comments section for this post on the AEA365 webpage so that we may enrich our community of practice. Would you like to submit an AEA365 Tip? Please send a note of interest to AEA365@eval.org. AEA365 is sponsored by the American Evaluation Association and provides a Tip-a-Day by and for evaluators. The views and opinions expressed on the AEA365 blog are solely those of the original authors and other contributors. These views and opinions do not necessarily represent those of the American Evaluation Association, and/or any/all contributors to this site.