
Hello. We are Mingyu Feng and Kelly Collins with WestEd’s Learning and Technology group. Mingyu is a Senior Research Associate who directs several Institute of Education Sciences, National Science Foundation, and Education Innovation and Research funded experimental studies. Kelly is a Research Associate who is a pro in data manipulation and analysis.
There is no doubt that technology has become integral to learning these days. Schools have adopted new educational technologies (edtech) programs, not only to maintain learning during school closures but also to recover from the pandemic related learning loss. The average number of edtech tools school districts access each month has almost tripled over the last several years, according to a report released this month by LearnPlatform.
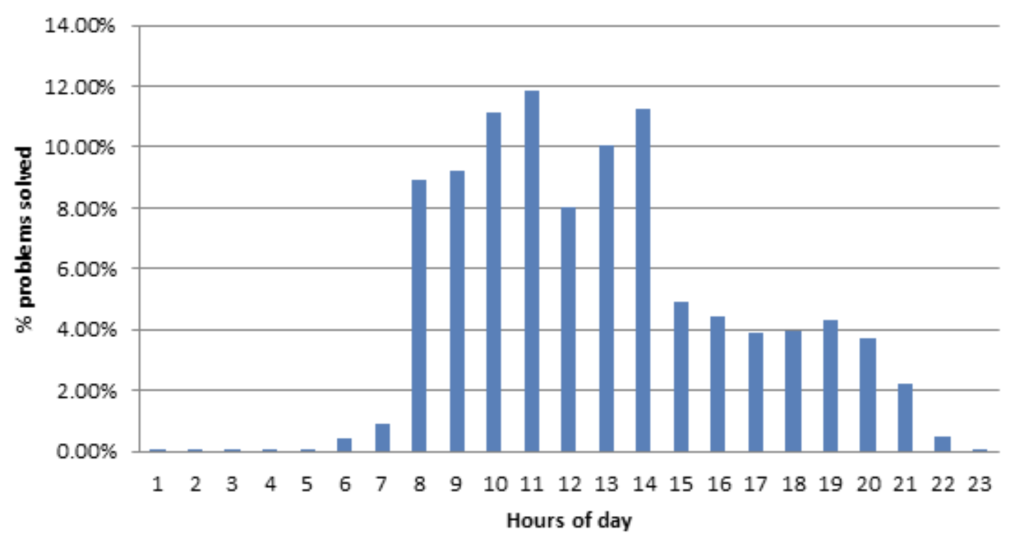
With these new tools comes the wealth of user activity data, an action-level time-stamped log (aka “the click stream”) of user interactions with the platform. Such digital use data is a continuous, detailed, and objective source for examining adherence, exposure, and uptake of program implementation. Analytics based on such data can help improve the quality of research by informing further product development, setting thresholds of dosage and fidelity, and exploring relationships between usage and learning outcomes.In an efficacy trial, we analyzed user data of an edtech program to determine whether teachers were using the program according to the specified use model, whether certain features were utilized as desired, and the amount, frequency, and patterns of student use. For example, the data suggested that the homework intervention was most used during the school time (Figure 1), which was unexpected, and we then conducted interviews to look for explanations for the pattern.
Yet, newly developed edtech products are often a work-in-progress, so are their backend logging systems and databases. The quality and usefulness of digital data is contingent on system design, which is usually outside the researchers’ lens. It can be too easy to blindly trust that the data sets shared with us contain everything asked for or expected.
As researchers, we are good at coming up with research questions and conducting data analysis to address them. But are we asking the right questions about the data itself and the systems that are generating that data? The following three questions can help you get started and avoid some pitfalls:
- Does the system collect the data I want to answer the research questions?
- Do the variables give me the information I think they give me?
- Do I get all the data I asked for, not too much or too little?
Lessons Learned:
- Data is very “fragile”— for example, day-to-day data can be lost when a system decides to accumulate use record over time; enrollment data can be written over if a teacher reuses a class setup but unenrolls old students to add new ones.
- Never assume that the variable you are looking at captures the behavior you are trying to study unless you understand exactly how values in that variable are created. Check the codebook to make sure the variable definitions are clear and comprehensive; definitions should include what circumstances might lead to a null or missing value.
- Before working with any set of data, apply various ways to check the integrity of your data that are completely independent of each other.
Our experience suggests effective use of the data and analytics requires close collaboration between developers and evaluators. Triangulation with other sources of data such as observations and interviews help identify gaps in digital data and paint a full picture of intervention implementation.
The American Evaluation Association is hosting Integrating Technology into Evaluation Topical Interest Group (ITE TIG) Week. The contributions all this week to AEA365 come from the ITE TIG members. Do you have questions, concerns, kudos, or content to extend this AEA365 contribution? Please add them in the comments section for this post on the AEA365 webpage so that we may enrich our community of practice. Would you like to submit an AEA365 Tip? Please send a note of interest to AEA365@eval.org. AEA365 is sponsored by the American Evaluation Association and provides a Tip-a-Day by and for evaluators. The views and opinions expressed on the AEA365 blog are solely those of the original authors and other contributors. These views and opinions do not necessarily represent those of the American Evaluation Association, and/or any/all contributors to this site.