
Hi, I am Rick Davies, an evaluation consultant based in Cambridge, UK.
While there have been many attempts to define innovation, I am interested in definitions that make innovation evaluable. My current preference is: “Innovation is invention plus use “. While measuring the use of product or service or idea seems relatively unproblematic, measuring invention seems much more challenging. If the essence of the invention is newness i.e. difference from everything else already existing, then how do you measure that?
Lesson Learned:
There are measures used within the field of Social Network Analysis (SNA) that can help. In SNA distance between actors, or any other kind of nodes in a network, is measured in terms of “geodesics”, i.e. the number of links between any two nodes of interest. There are various forms of distance measure based on geodesics but one simple one is “Closeness”, which is the sum of geodesic distances from a node in a network and all other nodes in that network. In the network below, Node 7 has a closeness measure of 28 whereas node 9 is 17. Bear in mind – a lower number means a closer relationship between a given node and all others.
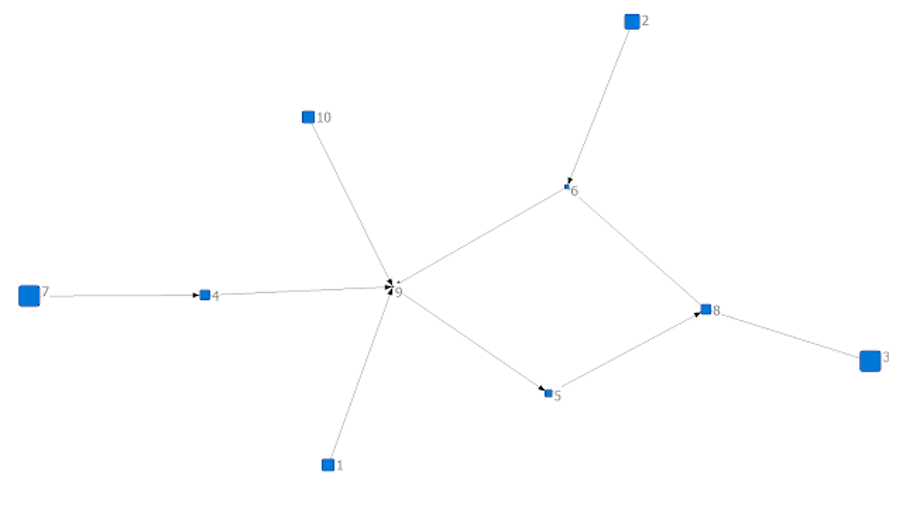
How do we use this network perspective? Perhaps counter-intuitively, one would ask the inventor/owner of an invention to identify what other product (/service/idea), in a specific population of products, that their product was most similar to. All other unnamed products would be, by definition, more different. After repeating this question for all owners of their products in a population of interest their aggregated choices can be displayed in what SNA people call an “adjacency matrix”, where a cell value (1 or 0) tells us whether or not a specific row product is seen as most similar to a specific column product, or not. Such a matrix can then be visualised as a network structure, and closeness values can be automatically calculated for all nodes in that network using SNA software (I use UCINET/Netdraw). In small networks some nodes will clearly be further from other nodes, than others. For larger and more complex networks node size can automatically be sized according to their closeness measure. In addition, algorithms will ensure that nodes with few links with others will be on the periphery of the network, whereas those with many will be in the centre. The number of links to a node is an additional measure of closeness.
In a “most similar to” type of network visualisation three different measures are possible:
1. Measures of how relatively different a given product or process is from all others in a population of interest
2. An aggregate measure of diversity in a whole population of products. Newark density is one such measure. Sparse networks are more diverse than densely connected networks.
3. Identification clusters of self-similar products within that population, by using methods variously suitable to simple or more complex networks
Hot Tip: There are of course qualitative as well as quantitative dimensions to novelty. While closeness measures are useful these can also be complemented by a qualitative inquiry which asks, “If X is most similar to Y, what are the significant differences between X and Y?”. By the way, this is the type of question patent examiners ask those lodging patent claims.
What next? The Most Significant Change technique is a participatory means of identifying and evaluating change. Collected MSC stories can be subject to content analysis, resulting in a matrix showing which stories share which themes with which other MSC stories. A network visualisation of the matrix will show some stories in the centre of the network structure, and others on the periphery. A hypothesis could then be tested: Stories on the periphery of the network will be seen as more novel, relative to those on the periphery. If not, would the addition of new themes to the content analysis make a difference?
Rad Resource: Stirling, A. (2007). A general framework for analysing diversity in science, technology and society. Journal of the Royal Society Interface, 4(15), 707–719.
Do you have questions, concerns, kudos, or content to extend this aea365 contribution? Please add them in the comments section for this post on the aea365 webpage so that we may enrich our community of practice. Would you like to submit an aea365 Tip? Please send a note of interest to aea365@eval.org. aea365 is sponsored by the American Evaluation Association and provides a Tip-a-Day by and for evaluators.