
My name is Miranda Chen Musgrove and I am an ecologist, science education researcher, educator, and program evaluator. I love working with clients to determine their program evaluation needs, collect and interpret data, and improve their programs to impact their community positively. One of the ways I do this is through Qualtrics.
You and your clients have most likely heard of Qualtrics, perhaps taken a feedback survey through Qualtrics, and may even be a customer of this popular survey data collection tool. But have you ever delved into the other functions Qualtrics has embedded in its platform?
I have recently begun to use Qualtrics as a quick, formative, participatory evaluation tool, particularly in utilizing the Reports function. Here’s why this is great:
Quick: By using the Reports function already embedded in Qualtrics, developing a preliminary report that continually updates with new responses from your Qualtrics survey to share with your clients, is fast and easy.
Formative: By providing clients with such short turn-around reporting on program survey data, they can consider changes and implement improvements to their programs just as quickly for the better of those they serve.
Participatory: Ideally, the client team would be invited to participate in meaning-making and interpreting the data together with the evaluator, identifying the main take-homes to be implemented immediately for the program.
If this piques your interest, I’ve provided screenshots below, with circled functions within Reports to help get you started!
Cool Tricks
First, you’ll need to click into the survey you’ve developed in Qualtrics, where the data is being collected, and then select the Reports tab at the top of the page. From there, a blank document is created for you to begin selecting answers to questions from the survey you would like to display. I begin with a title and date and then select questions–both quantitative and qualitative–to share back to the client.
For quantitative data, I tend towards the bar graph function, as seen in the right-hand customizable bar.
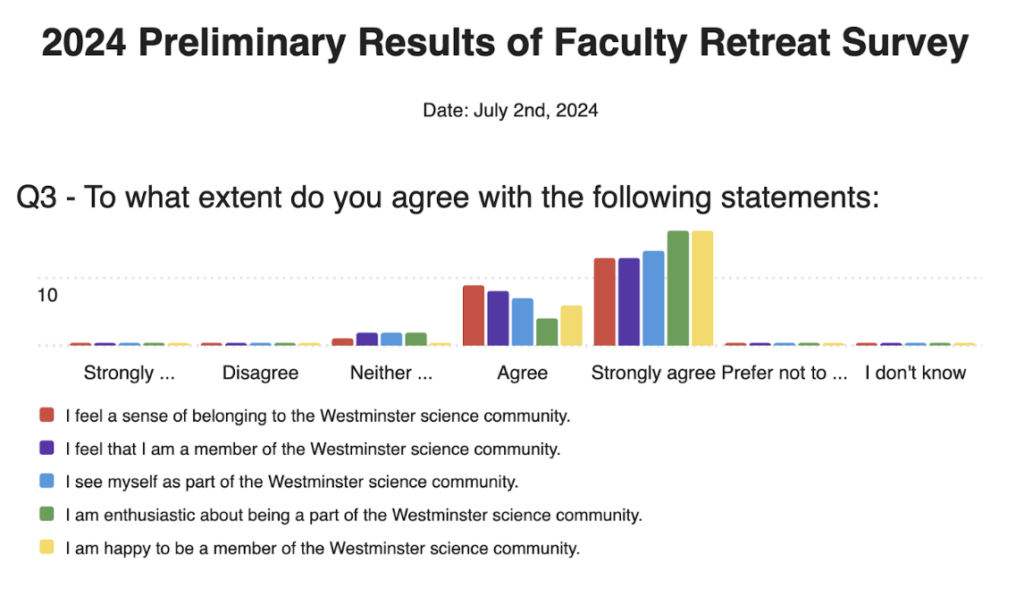
You’ll notice that the data may not be clear with the default bar graphs, so I do the following for clarity:
- remove options not selected by participants (e.g., Strongly Disagree, etc.)
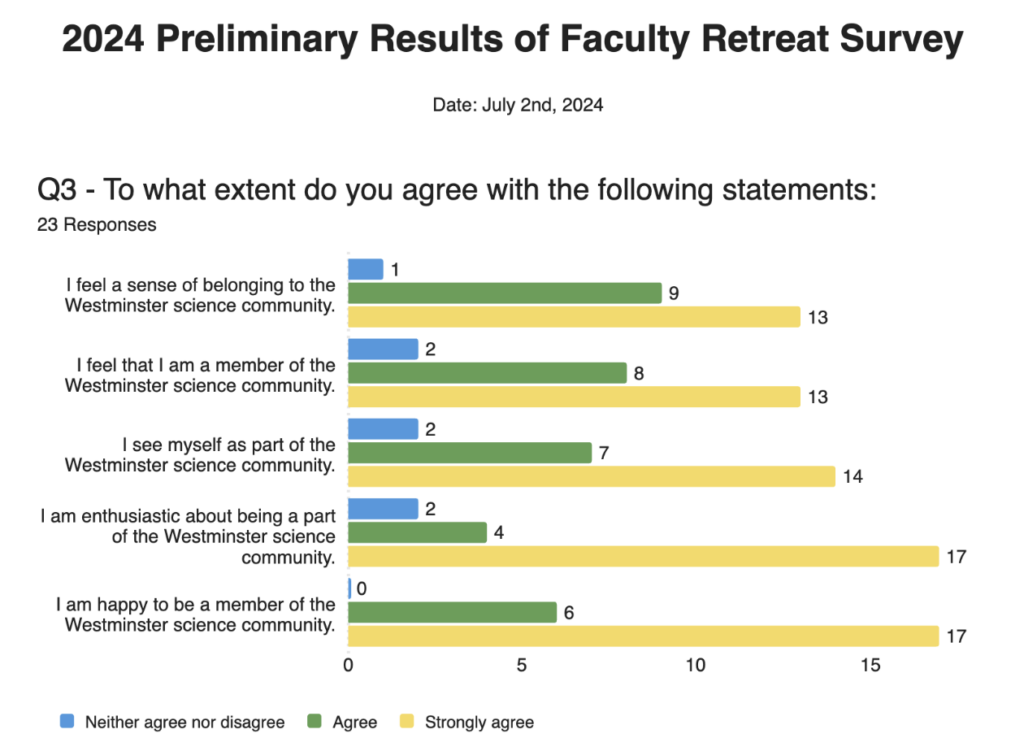
- transpose the graph so the question statements are on the x-axis
- add the count of responses per statement
- add total count of responses
- make it a Horizontal Bar graph, if it is still hard to read the statements on the x-axis
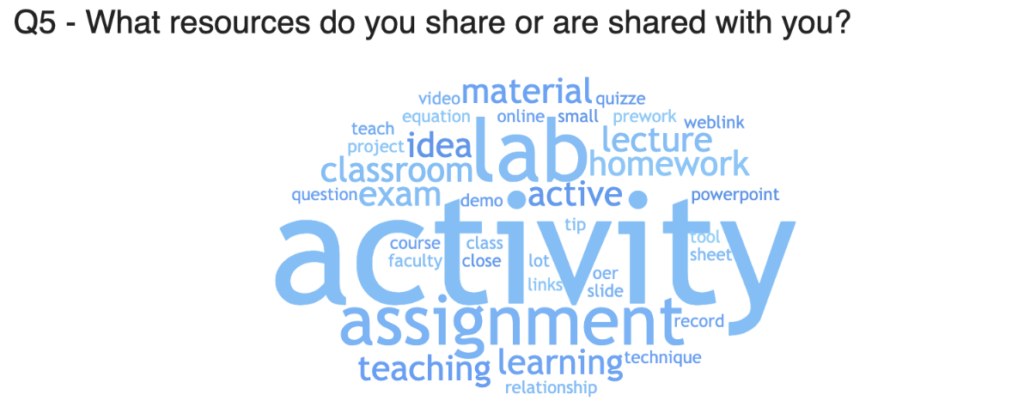
For qualitative data, you can present all the data in a long-form table, so you and your client can read through all the responses. You can also translate that text into a WordCloud, with some customizable features.
Hot Tips
- Download the Report as a Word document and upload it into a shared space with your clients, for instance, a Google Doc. Invite the client team to make meaning of the data with you via commenting or carving out a section of the report for action items. This activity can be done asynchronously or synchronously and then discussed at a team meeting.
- There are limitations in the Reports function (e.g., the count does not display because they overlap, or the statements are cut off) but be patient and creative with it! Look to Qualtrics resources for Reports if needed.
- Qualtrics also provides a dashboard function that would allow for more cross-sectional comparison within the survey data in the Results tab.
The American Evaluation Association is hosting Goshen Consulting, an independent consulting firm. Do you have questions, concerns, kudos, or content to extend this AEA365 contribution? Please add them in the comments section for this post on the AEA365 webpage so that we may enrich our community of practice. Would you like to submit an AEA365 Tip? Please send a note of interest to AEA365@eval.org. AEA365 is sponsored by the American Evaluation Association and provides a Tip-a-Day by and for evaluators. The views and opinions expressed on the AEA365 blog are solely those of the original authors and other contributors. These views and opinions do not necessarily represent those of the American Evaluation Association, and/or any/all contributors to this site.
Thanks for the post.
I’ve used Qualtrics a lot, and am familiar with their reporting function, but it’s not a GOOD reporting option. It may be good for YOU to understand trends in the data coming in from a survey, but it shouldn’t be used for end-users.
Qualtrics report charts are cluttered, too busy, and not user-friendly.
Download the data with Excel and use effective Data Visualization principles to make good engaging visuals. 🙂