My name is Matt Keene; I work with the Environmental Protection Agency and coordinate the Environmental Evaluators Network. Chris Metzner (freelance graphic designer and data visualization artist) and Jeff Wasbes (independent evaluation consultant with ResearchWorks, Inc.) helped enormously with this post.
In 2009 Oregon became the first state to enact a law requiring paint manufacturers to manage leftover consumer paint. The law is part of the broader producer responsibility movement and requires the paint industry to implement programming to reduce paint waste, increase reuse and recycling, and dispose of unusable paint.
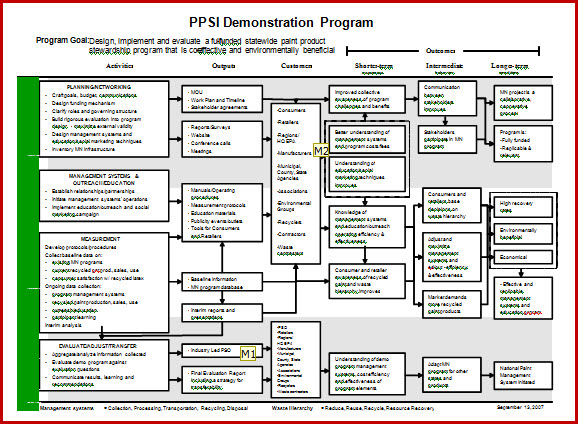
In the early days of the Paint Product Stewardship Initiative’s (PPSI) evaluation of the Oregon Paint Stewardship Pilot Program, the evaluation team had some problems…
We drew a picture for the paint people.
But the paint people did not understand and they were unhappy.
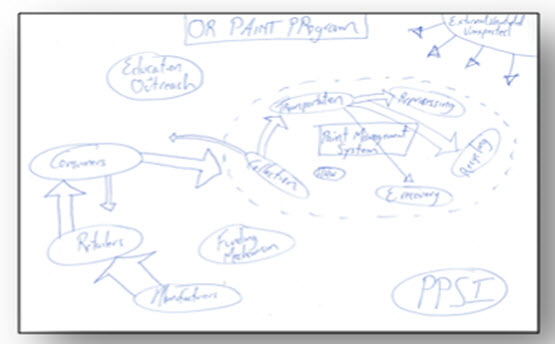
So we practiced on the drawing board.
And we phoned, emailed, read, talked, napped, and cried just a little.
But it still wasn’t right.
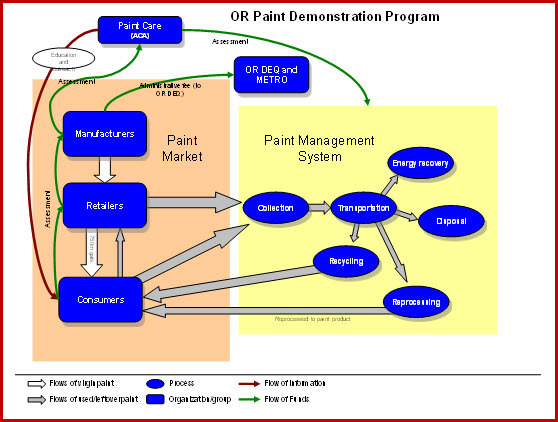
So we sent all of our paint picture problems to an artist,
Who made the paint picture pretty.
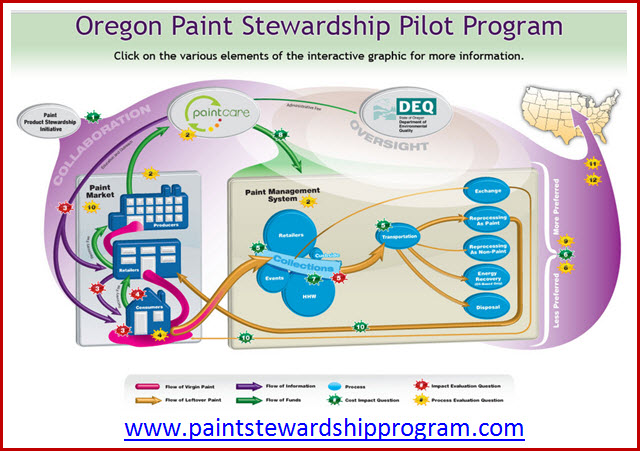
Now the paint people understand and everyone is happier.
Integrating web 2.0, graphic design and data visualization with traditional logic models creates opportunities to expand the access and use of the evaluation process. Fuzzy logic models aim to embrace fluid and approximate reasoning and varied context to improve the capacity of logic models to navigate non-linearity, feedback loops, and other concepts of complexity integral to the environmental programs and policies.
Hot Tip: Understanding the different kinds of complexity inherent in a system can be a daunting task:
- Detail (or combinatorial) complexity describes the type where one must keep track of many variables and find the combination which yields the best (desired, efficient, effective) outcome.
- Dynamic complexity describes the type where cause and effect are subtle and where the effects over time of interventions are not obvious. This is the sort where we seek to understand the effects of system structure and feedback loops on outcomes of interest over time.
Rad resources:
- For systems analysis and modeling: www.systemdynamics.org
- For visualization: www.edwardtufte.com
Hot Tips:
- Color: Organize your image by keeping your colors consistent across similar subjects. Overall, use a soft color scheme to keep users relaxed while viewing an intricate graphic.
- Balance: Though a graphic may be asymmetrical, flowing shapes, curving lines and blending soft colors convey balance through movement.
- Symbolism: Replace key words with images. In our graphic, an image of a factory replaced “producers” and a house for “consumers.”
Rad Resources:
The American Evaluation Association is celebrating Earthweek with our colleagues in the Environmental Program Evaluation AEA Topical Interest Group. The contributions all this week to aea365 come from our EPE TIG members. Do you have questions, concerns, kudos, or content to extend this aea365 contribution? Please add them in the comments section for this post on the aea365 webpage so that we may enrich our community of practice. Would you like to submit an aea365 Tip? Please send a note of interest to aea365@eval.org. aea365 is sponsored by the American Evaluation Association and provides a Tip-a-Day by and for evaluators.
My name is Matt Keene; I work with the Environmental Protection Agency [JM1] and coordinate the Environmental Evaluators Network[JM2] . Chris Metzner (freelance graphic designer and data visualization artist) and Jeff Wasbes (independent evaluation consultant with ResearchWorks, Inc.) helped enormously with this post.
In 2009 Oregon became the first state to enact a law requiring paint manufacturers to manage leftover consumer paint. The law is part of the broader producer responsibility movement and requires the paint industry to implement programming to reduce paint waste, increase reuse and recycling, and dispose of unusable paint.


Hello Mr. Keene,
Thank you for sharing your ideas on visual data. I am studying evaluation as part of a Master’s Degree in Education. The need for varied methods of explaining complex concepts is the concern for educators who strive to capitalize on learning preferences. You article was referred to me by a classmate who noticed I was working on the idea of differentiating the process model from the vantage point of the client and of the grantee (see Using Logic Models to Build Understanding Between Foundations, Grantees and Evaluators by Ranjani Paradise, Jan. 28, 2020.) Following your recommendation, I investigated the work of Edward Tufte. Thank you!
I do have questions concerning data and evaluation: What is the most efficient method of collecting data for a process that ultimately turns out to be fuzzy? What was the initial approach for the paint project? And did it get altered into something fuzzy upon investigation? Or did you team realize it would be fuzzy from the start?
I know this may not be a deep and intellectual question, I just wonder what happens at the beginning of a process that yields such a thorough map as shown in your post.
Also, just to add, the Rad Resources at the end, How to Choose the best colour scheme and The Best Tools are now 404 on the web.
Thanks for reading my reply!
Cathy
I’m PhD student
can you help me to do
fuzzy logic modeling of collective intelligence for students use augmented reality in education
Thank you
Play with the fuzzy logic model and leave suggestions on how to improve it using the facebook page (link below the image):
http://www.paintstewardshipprogram.com