
Hello! I’m Tony Fujs, Director of Evaluation at the Latin American Youth Center, a DC based non-profit organization. Today, I want to share my experience using R and ggplot2 for data visualization. Ggplot2 is a great tool from the R toolbox (a package, in R lingo). It relies on the powerful Grammar of Graphics framework, which helps “shorten the distance from mind to paper” (Hadley Wickam).
I started using R three years ago, and it has now become my main tool for data analysis and visualization.R is known to have a steep learning curve though, so before getting started, it’s probably a good idea to do a little bit of “cost-benefits” analysis, and check if R is a good fit for you.
Lessons Learned: Benefits
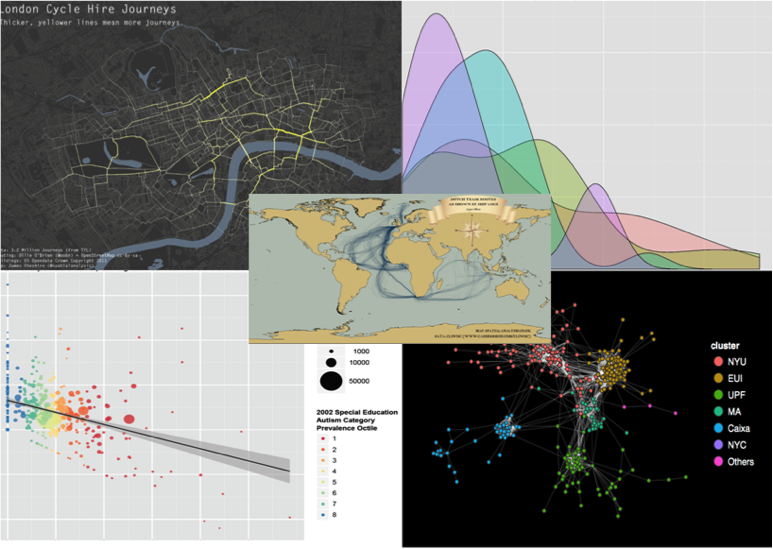
- More flexibility: R currently meets 99.9% of my dataviz needs. From simple Bar charts, to Maps, to Social Networks… you name it! I can do it directly from R. No need to learn multiple tools anymore.
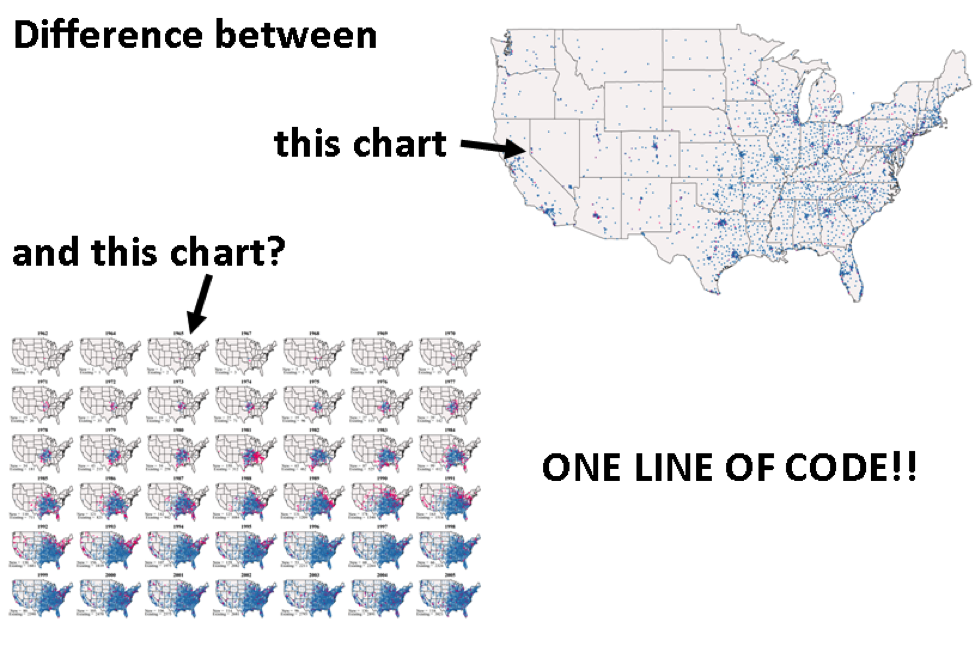
- Increased productivity: I often need to generate the same charts on multiple data sets, or multiple subsets of the same dataset. With R it takes almost no effort to do this.
- Transparency: Who never did open an Excel file with numbers that seemed to come directly from a magic hat? Coding forces you to become more transparent, and makes your analyses and dataviz easier to replicate. Your colleagues and your future self will thank you for this!
Lessons Learned: Costs
By the way, did I mention that R is free? Your costs-benefits analysis is looking pretty good! You still have some time investment ahead though… In my experience, there are two main barriers when starting dataviz with R and ggplot2:
– Understanding the Grammar of Graphics: There is a strong logic behind the grammar of Graphics framework. Taking some time to understand it will make your learning experience much smoother.
– Learning to code: If you don’t have any prior programming experience, moving from a point and click environment to writing code may entail some frustration.
Rad Resources: Here is a list of resources to help minimize learning costs:
1) Get familiar with the grammar of graphics:
- Read this paper by ggplot2 creator Hadley Wickam.
- Check out this slide deck from my dataviz workshop using R and ggplot2. Pay special attention to exercise on slide #25
2) Get familiar with the R environment:
- Take this great interactive tutorial by DataCamp
3) Start playing with ggplot2
- Copy-paste existing code from the web, and start tweaking it. A good place to start is the ggplot2 section of the R Cookbook website.
The American Evaluation Association is celebrating Data Visualization and Reporting (DVR) Week with our colleagues in the DVR Topical Interest Group. The contributions all this week to aea365 come from DVR TIG members. Do you have questions, concerns, kudos, or content to extend this aea365 contribution? Please add them in the comments section for this post on the aea365 webpage so that we may enrich our community of practice. Would you like to submit an aea365 Tip? Please send a note of interest to aea365@eval.org. aea365 is sponsored by the American Evaluation Association and provides a Tip-a-Day by and for evaluators.