
Hello! Robert Blagg, Todd Franke, and Jonathan Litt, of UCLA’s Agile Visual Analytics Lab (AVAL) here to share some lessons learned, hot tips, and rad resources related to speaking truth to powerful stakeholders through data visualization.
Our successful engagement of powerful stakeholders around data visualization, designing utilization-focused visuals, and ensuring use and sustainability of data visualization solutions has required several deliberate considerations at each development stage. To generate powerful stakeholders’ buy-in to visualization we demonstrate the hidden value in their data and provide opportunities for hands-on learning and consequent action.
Lesson Learned:
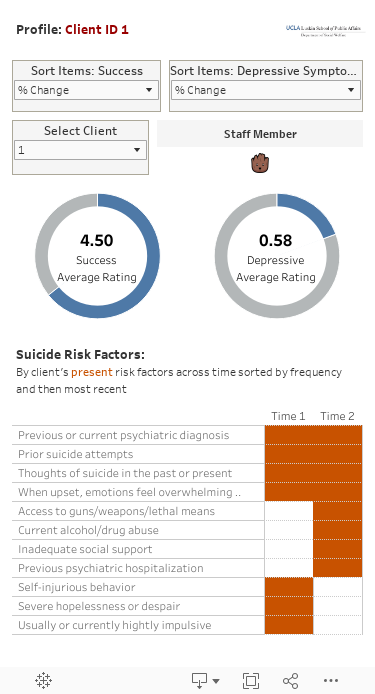
When introducing stakeholders to visualization, show them their own data preferably using indicators or measures they’re familiar with in other contexts or more traditional reporting formats. These introductions should also include demonstrations of diverse ways stakeholders might interact with their data.
Designing visualizations for powerful stakeholders is more successful when carefully considering the intended uses of target users (e.g., viewing format or dissemination format) and stakeholders’ feedback regarding interaction with visualizations. For example, we provide stakeholder with alternative formats for viewing and sharing to facilitate use in convenient ways for intended uses (e.g., visualizations various suited for sharing via large presentation or computer desktop/tablet, via mobile device, or in print).
Rad Resource:
Several data visualization experts put together this visualization of a “Visual Vocabulary” to help guide viz developers to forms that tend to communicate various types of relationships well. Such guidelines help us to efficiently develop visualizations that meet the intended uses of intended users.
To ensure data visualization solutions are useful and sustainable, we help build the capacity of influential stakeholders consume and disseminate evaluative information via visualization, and position it as a key driver of the evaluation feedback loop.
Hot Tip:
To build stakeholder capacity to use visualizations we often hold “fireside chats” or brief (e.g., 30 min) routine workshops in which we guide stakeholders through data viz exercises focused on one aspect of data visualization that will facilitate their use cases. Exercises may involve stakeholders answering questions via the data visualization that may be particularly relevant to them, and providing feedback on the actions they took to find the answers. We find these exercises are most useful when questions asked require the stakeholders to become familiar with new visual formats and key interactive elements (e.g., filters or parameter switching).
The lessons, resources, and tips highlighted here are but a few that we use to translate complex ideas to powerful stakeholders, who possess the influence to make change through data visualization.
The American Evaluation Association is celebrating Data Visualization and Reporting (DVR) Week with our colleagues in the DVR Topical Interest Group. The contributions all this week to aea365 come from DVR TIG members. Do you have questions, concerns, kudos, or content to extend this aea365 contribution? Please add them in the comments section for this post on the aea365 webpage so that we may enrich our community of practice. Would you like to submit an aea365 Tip? Please send a note of interest to aea365@eval.org. aea365 is sponsored by the American Evaluation Association and provides a Tip-a-Day by and for evaluators.