
Hi, we are Dr. Nicole Bowman (Lunaape/Mohican), Policy Chair, Indigenous Peoples in Evaluation, American Evaluation Association; Editor, Roots and Relations, Canadian Journal of Program Evaluation; and Board Member, International Evaluation Academy and Dr. Jeremy Braithwaite, Communications Co-Chair, Indigenous Peoples in Evaluation, American Evaluation Association; Tribal Research Specialist, Tribal Law and Policy Institute; Co-Founder, EvaluACT.
Colonial practices of genocide, assimilation, and exclusion are not remnants of the past. They are alive and well globally in the settler colonial state that we currently live in. Settler colonialism has a relationship to the past that can and does connect without interruption to the current and future states. To heal that, you must know the past and change your current mindset and behaviors. Academia is not immune to the legacy of settler colonialism, especially in the field of evaluation. This blog asks the reader to move beyond settler time to restore and strengthen relationships for being good kin within and through our work, namely with decolonized data visualization strategies.
We are starting to see some of the field’s non-Indigenous contributors speak, write, and behave in support of decolonizing data visualization, given its historic rooting in colonization, whiteness, and male privilege. The erasure of lands, First Nations governments and communities, and Indigenous peoples from visualized data is also actively being challenged by Indigenous scholars. Indigenous peoples continue to work together to empower culturally responsive and culturally specific representation through intentional Indigenous data visualization strategies. Even non-Indigenous and emerging scholars like the University of Wisconsin-Madison’s Carl Sack are engaged in resistance mapping using treaty maps, not colonized maps (post-contact), as critical, feminist, Indigenous, and counter-cartography theories and methods are providing many other ways to decolonize visuals. Data visualization should always be top of mind, not just a last thought for reporting findings. These scholars and examples offer the field an innovative way to support decolonization in policy and governance in support of upholding American Indian treaties, First Nations constitutions, and the human, civil, and land-based rights of First Nations governments and people as outlined in the United Nations Declaration of the Rights of Indigenous peoples (2007).
Decolonized data visualization must also steer clear of cultural appropriation and misrepresentation of Indigenous people. For better or worse, Indigenous people are largely known for the beautiful things they create—from simple objects, tools, and artifacts that are used for day-to-day practices and living to ornate cultural regalia used during ceremony. It is important to recognize, however, that while these things are aesthetically beautiful, they are made for distinct purposes. They are not “art for art’s sake.” Numerous industries (sports, fashion, etc.) have been complicit in appropriating these images for material gain. The data visualization field is no exception. In our effort to ensure culturally responsive and culturally specific representation of Indigenous data, we must also strike a delicate balance to ensure we are not perpetuating stereotypes or appropriating sacred cultural content.
Hot Tips
Methods of decolonizing data visualization must be rooted in a historical, cultural, and contemporary context. It is the evaluator’s professional and ethical responsibility to be aware, not recreate harm, and work towards undoing the settler colonial practices that are rooted and seeded as the typical way we do things in the field. Western is not neutral, including images and communications generated by data visualization that continued to be shackled to colonized practices and work products.
Decolonized data visualization must start early in the evaluation process. This process starts with conceptualization, selection, and utilization of images appropriately and responsibly that can be part of a design document and can be used to support project development, instruments, training, and technical assistance activities as well as for communication, reporting, and dissemination.
Rad Resources
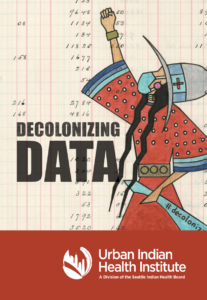
- Decolonizing Data Guidebook by the Urban Indian Health Institute
- Native Digital Decolonized Land Maps
- Indigenous Mapping Collective
The American Evaluation Association is hosting Data Visualization and Reporting (DVR) Week with our colleagues in the DVR Topical Interest Group. The contributions all this week to AEA365 come from DVR TIG members. Do you have questions, concerns, kudos, or content to extend this AEA365 contribution? Please add them in the comments section for this post on the AEA365 webpage so that we may enrich our community of practice. Would you like to submit an AEA365 Tip? Please send a note of interest to AEA365@eval.org. AEA365 is sponsored by the American Evaluation Association and provides a Tip-a-Day by and for evaluators. The views and opinions expressed on the AEA365 blog are solely those of the original authors and other contributors. These views and opinions do not necessarily represent those of the American Evaluation Association, and/or any/all contributors to this site.