

Hello AEA365 community! I am Zoraya Cruz-Bonilla, Data Research Analyst in the Office of Student Affairs Assessment at Binghamton University.
Before the onset of the pandemic, I had been thinking about data visualization for the blind or vision impaired. Indisputably, applying the common practice of adding image captions to data visualizations is a great rule of thumb. Not only to aid the reader but also so that the information reaches a wider audience – or, to put it slightly more elegantly, to propagate the seeds of knowledge. We can all check the box for textual descriptions underneath line, bar, and pie charts that programs can read. But the question remains, how does one convey complex visuals? Especially now that they have become easier to produce; inspired by design over functionality; and/or overwhelm information uptake. I explored the pitfalls of complex data visualizations by doing a cursory search online and posing general questions to a handful of data visualization experts. Here is what I concluded.
Lessons Learned:
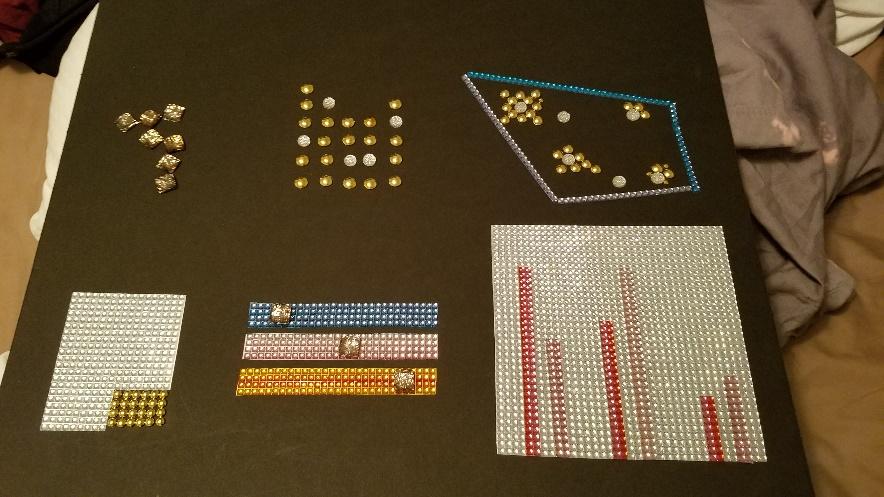
If you can’t see it, then touch or hear it.
I was intrigued to find out how a multi-sensory experience can serve as a proxy for accessing visual representations of data. Perhaps we can take some valuable lessons from a Canadian company that creates tactile reproductions of famous paintings for vision-impaired patrons of a museum. As fascinated as I was about this idea and ready to create the first data visualization prototype.
Admittedly there were quite a few “opportunities for improvement” before this could be a viable approach – and given the way we must interact with the world due to the pandemic, a touchless approach is the way to go. But if not tactile then maybe auditory (or both)? My ongoing search led me to a new term, sonification. Evidently, the SAS® Graphics Accelerator transforms graphs and charts to sound to “paint audio picture.” It uses non-speech audio (i.e., sound location and pitch) to convey the details of not just bar charts, but also heat maps, time-series plots, histograms, etc.
On a similar note, I was pleasantly surprise to find a PubMed article by Brewster on visualization tools for blind people using multiple modalities. The authors conducted an experiment in which they concluded that non-speech sounds are an effective method for presenting visual material; sonification significantly reduced the effort to perform data comprehension tasks and participants answered questions correctly more quickly.
These alternative ways of consuming data visualizations look promising for making information more accessible. Yet, I believe that there is more to tinker with. What is your take on the topic? I welcome your comments, experience with alternate formats, or additional questions that should be posed.
The American Evaluation Association is celebrating Data Visualization and Reporting (DVR) Week with our colleagues in the DVR Topical Interest Group. The contributions all this week to aea365 come from DVR TIG members. Do you have questions, concerns, kudos, or content to extend this aea365 contribution? Please add them in the comments section for this post on the aea365 webpage so that we may enrich our community of practice. Would you like to submit an aea365 Tip? Please send a note of interest to aea365@eval.org. aea365 is sponsored by the American Evaluation Association and provides a Tip-a-Day by and for evaluators. The views and opinions expressed on the AEA365 blog are solely those of the original authors and other contributors. These views and opinions do not necessarily represent those of the American Evaluation Association, and/or any/all contributors to this site.