
Hello! I am Eryn Collins, Research Associate, from Choices Coordinated Care Solutions (https://www.choicesccs.org), a national non-profit organization that uses evidence-informed methods to support individuals in community settings who have significant behavioral, emotional, or substance use challenges.
In our organization, we create Performance Quality Improvement (PQI) plans that are team-driven, individualized, and measurable. Our methods for data use, grounded in the Program Evaluation Standards (https://jcsee.org/program/), are intended to create meaningful processes and outputs that address the communication needs of a variety of audiences.
Rad Resource:
Microsoft Power BI is practical and effective for creating reports designed to track progress toward these goals. Power BI’s interface is user-friendly and allows us to produce reports with a clean and professional appearance. By default, Power BI reports maintain consistent formatting across multiple pages which improves how we communicate data trends by eliminating extraneous or distracting details for our decision-makers.
Hot Tip:
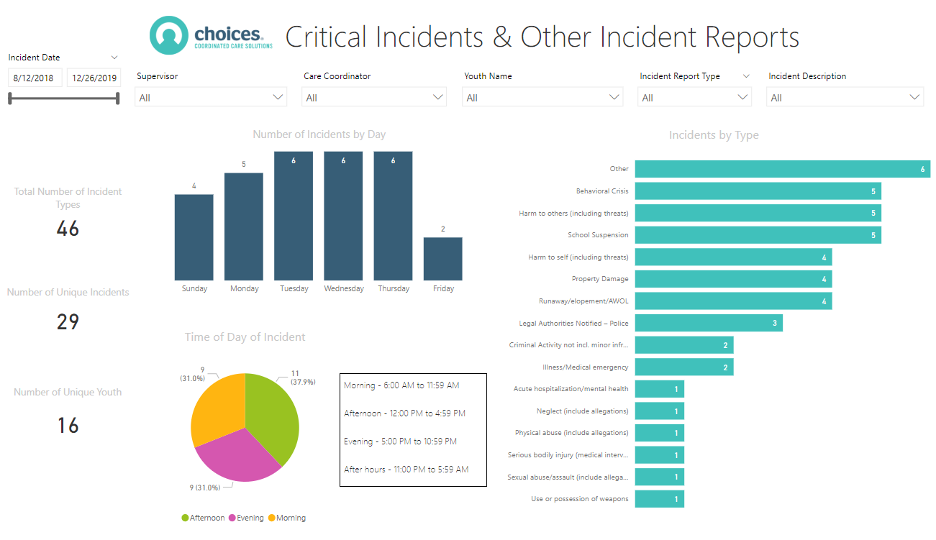
To make our charts more readable, we utilize the data labels function. We also use text boxes to create our own labels to explain any data elements that may need additional information (in the example above, we used a text box to explain what hours our time periods encompassed).
Cool Trick:
Not only can you select colors for every visualization (including hex codes for maximum customization), but also you can upload your own color theme as a template! We employ our Choices colors on every report and insert our Choices logo image.
Lesson Learned:
Using Power BI has improved the accuracy of our data, which improves the quality of our conclusions. When it comes to adding visualizations, we found that creating a new page and splitting charts over multiple pages works better than crowding visuals on one page of a report. Filters can also be very useful in allowing your users to view different categorizations of data. On our reports, filters have become a standard feature.
Hot Tip:
Our department has the Power BI Pro License ($10 a month per person), which allows us to publish and share content, but there is also a free version available. Power BI can be used in an online app, as well as downloaded and used as Power BI Desktop. We’ve found that the desktop version’s capabilities far exceed the app version, but the app is useful for quick updates and sharing. We share our reports on SharePoint using the easy-to-generate link in the Power BI app. Importantly, the SharePoint platform is password protected, which means our underlying data confidentiality is maintained.
The American Evaluation Association is celebrating Behavioral Health (BH) TIG Week with our colleagues in Behavioral Health Topical Interest Group. The contributions all this week to aea365 come from our BH TIGmembers. Do you have questions, concerns, kudos, or content to extend this aea365 contribution? Please add them in the comments section for this post on the aea365 webpage so that we may enrich our community of practice. Would you like to submit an aea365 Tip? Please send a note of interest to aea365@eval.org. aea365 is sponsored by the American Evaluation Association and provides a Tip-a-Day by and for evaluators. The views and opinions expressed on the AEA365 blog are solely those of the original authors and other contributors. These views and opinions do not necessarily represent those of the American Evaluation Association, and/or any/all contributors to this site.
Hi Sheila,
I am a graduate student taking a course on evaluation and have been visiting the AEA365 website regularly. The title of your article captured my attention instantly because I just completed an assignment that required us to create a program evaluation design. During this assignment, and throughout the course, the importance of reporting has been a common theme. More so, the importance of reporting data in a digestible manner that will resonate and therefore bring utility to the intended target audience.
A lot of emphasis has been placed on communicating in a clear manner that is easy to comprehend and digest by leveraging strategies such as executive summaries, evaluative language, clear and simple charts, using subheadings, etc. Your article supplements this notion, building on the fact that programs such as Microsoft Power BI can assist in creating meaningful processes and outputs that address the communication needs of a variety of audiences.
While I have not yet utilized this tool in my current capacity as an Instructional Designer, I can appreciate the advantages of using programs such as Microsoft Power BI to enhance the way that information is communicated to stakeholders. Thank you for your thought-provoking article.
Best regards,
Mikayla