

Hello! I’m Deven Wisner, Consultant for Empact Solutions and Wisner Analytics, LLC. I’m also the Communications Chair for the Arizona Evaluation Network.
As we think about fundamentals in evaluation, we can’t forget data visualization and reporting (DVR). In fact, if you ask me, that’s where the FUN in fundamental comes in! Realizing that capacity and resource constraints are a real consideration, I want to share the challenge that my clients experience. But first, some lessons learned…
Lessons Learned:
DVR is a a fundamental for evaluation because for most of us, collecting and analyzing the data is rarely our last step. Regardless of how participatory your approach is, sharing the evaluation findings is likely a component of your project. There is a demand to be able to clearly and quickly consume information. For many of us, this means rethinking our approach — going back to fundamentals of visualizing and reporting the results and adjusting as necessary!
From my work as an evaluation practitioner and with DVR capacity-building within organizations, I can tell you that it is much easier to implement a few best practices than a whole bunch. And, after you’ve experienced the success of delivering findings with some of these simple adjustments, I bet you’ll be ready for more.
Hot Tips: Deven’s 2019 DVR Challenge.
Reflecting on Your Evaluation Questions — Too often when developing visualizations we can get caught up in the excitement around making data fun. It’s important to channel that enthusiasm into meaningful communication. I encourage you to reflect on your previously determined evaluation questions. Your visualizations should provide a clear answer to these questions (or the appropriate information for your stakeholders to deduce an answer).

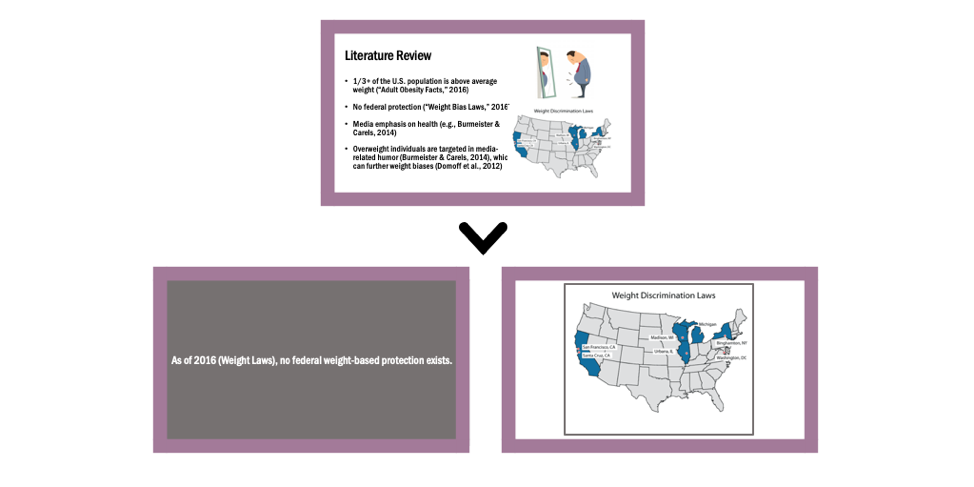
Rethinking Your Imagery — Almost equally as often, irrelevant imagery is included in our reports and presentations. Instead of adding a visual to fill space, I encourage you to assess the value of adding an image. Start with a blank slate…as you draft your work, only add things that create a meaningful association with your story. Get comfortable with white space. Instead of thinking of it as empty, reframe it as concentrating your consumer’s attention on what matters.
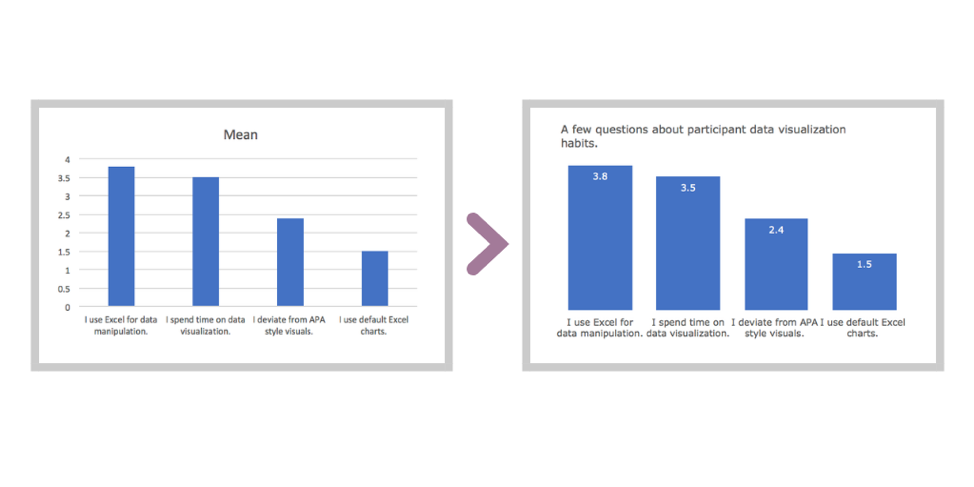
Eliminating Redundancies — I’m going to encourage you to reduce redundancies because including the same information twice doesn’t necessarily drive your message home. Instead, it distracts your readers, and they will likely spend unnecessary time determining its duplicative! In charts, I most often see this kind of clutter: (1) unnecessary grid lines, (2) data labels and an axis, and (3) legends.
Not only are these small time investments, they will stretch your approach to be more relevant to your stakeholders — ultimately building the value of evaluation.
Rad Resources:
- About Evaluation Matrixes by Sara Vaca for keeping eval questions front-of-mind!
- Engaging Audiences with Images for imagery tips!
- Basic to Bomb Column Charts for minimizing redundancies in column charts!
Interested in more evaluation fundamentals? Consider the 2019 #AZENet Conference!
The American Evaluation Association is celebrating Arizona Evaluation Network (AZENet) Affiliate Week. The contributions all this week to aea365 come from our AZENet members. Do you have questions, concerns, kudos, or content to extend this aea365 contribution? Please add them in the comments section for this post on the aea365 webpage so that we may enrich our community of practice. Would you like to submit an aea365 Tip? Please send a note of interest to aea365@eval.org. aea365 is sponsored by the American Evaluation Association and provides a Tip-a-Day by and for evaluators.