
Hi there! I’m Monique Farone (@moniquefarone), an internal evaluator at a local health department just outside Atlanta. At the 2018 American Public Health Association annual meeting, I presented a poster that examined data from our local Youth Risk Behavior Survey (YRBS) – data that I miraculously analyzed using R. I say that because I’m new to R, but as a result of that project, I’m excited to share insight on a package that I found to be a complete lifesaver for analyzing surveys with complex sampling designs (such as the YRBS).
Hot Tip: The next time you open R or RStudio, install the survey package. The survey package, developed by Thomas Lumley, is a complex survey design analysis package that lets you easily define and account for sampling weights, clusters, and much more.
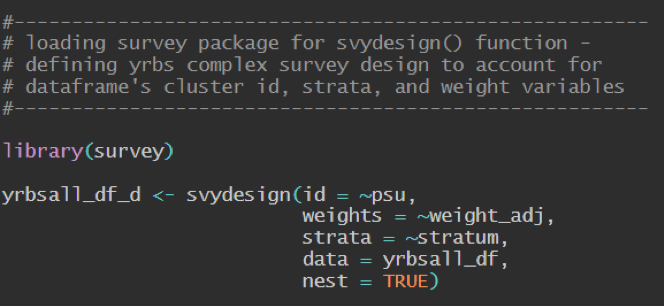
In the code pictured, I used the svydesign() function to specify the survey’s sampling design by assigning the cluster IDs, weights, and strata to their corresponding variable names in my data frame (in this case, psu, weight_adj, and stratum, respectively).
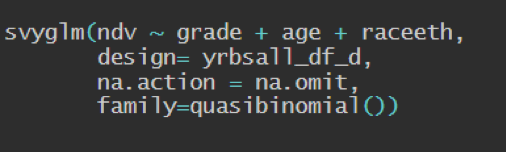
After specifying the survey design, you’re all set for using the package’s many preset functions for analyses. Need to run a Chi-squared test? Try using the svychisq() function. Need to run a logistic regression or an ordered logistic regression? Try using svyglm() and svyolr().
Hot Tip: When you’re using functions in the survey package, be sure to call data from the survey design you created using svydesign(), rather than the original dataset you may have imported. In the second series of code pictured, this is achieved by the line that reads “design = yrbsall_df_d”, which is the name of the survey design I created earlier.
Rad Resource: I am forever thankful for the CDC’s manual on Software for Analysis of YRBS Data, particularly Thomas Lumley’s section on analyzing YRBS data using R. Check it out for additional information on R, the survey package, and more code.
Thanks for reading! Please feel welcome to contact me directly or a leave comment with any questions or thoughts.
Do you have questions, concerns, kudos, or content to extend this aea365 contribution? Please add them in the comments section for this post on the aea365 webpage so that we may enrich our community of practice. Would you like to submit an aea365 Tip? Please send a note of interest to aea365@eval.org. aea365 is sponsored by the American Evaluation Association and provides a Tip-a-Day by and for evaluators.