
The posts for this week come from the Digital Data & Technology AEA Conference Working Group, and share how digital data and technology are factoring into reshaping evaluation.
Greetings. I’m Michael Bamberger and I have been involved with development evaluation since the 1960s. I would like to share with you some ideas on the need to address complexity in program evaluation, and how new sources of big data and data analytics are making this possible.
As development programs increase in size, scope, and duration, they become increasingly “complex” due to the increased number of components and stakeholders, and the need to understand the influence of external economic, political, environmental, and sociocultural factors affecting program performance. The interactions among these factors means it is no longer possible to apply many current evaluation designs that assume simple, linear cause-effect relationships between program inputs and outcomes. New complexity-responsive evaluation designs and data collection tools are required.

In this post, I highlight a few tips and resources for evaluators to use for understanding complexity in the programs they evaluate.
Hot Tips
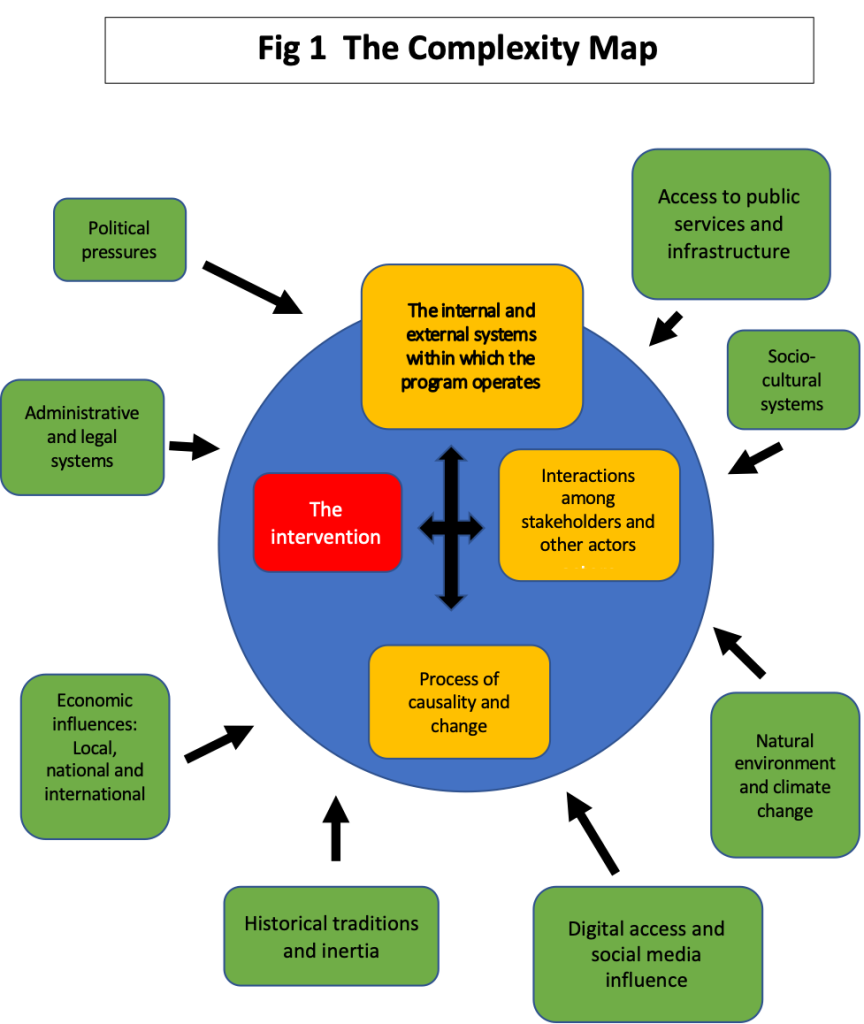
Constructing a complexity map of your program can help you navigate complex programs. The complexity map template above identifies four dimensions of complexity that should be assessed:
- Complexities inherent in the program itself.
- Interactions among program stakeholders.
- The external context in which the program operates.
- Technical questions concerning non-linear processes through which program outcomes are produced.
For relatively small programs, the map can be descriptive, but for larger programs, surveys and other sources of quantitative data may be required, and systems analysis tools and techniques might be incorporated. The increasing accessibility of big data now makes it possible to apply complexity analysis to larger, multiple component programs with broader geographical scope and longer timelines.
Innovations in digital data, specifically “big data” can strengthen complexity-responsive evaluation. One of the challenges that has limited the use of complexity analysis has been the limited access that evaluators have had to tools for the collection and analysis of the large volumes of data required for the application of complexity and systems analysis. The dramatic increase in the availability of big data and data analytics means that the required tools are becoming increasingly available. The table below lists some of the most important tools. For additional reading, this paper by York and Bamberger provides a detailed discussion of these tools and their application to evaluation.
Big Data Collection Methods
- Satellites and drones
- Social media analysis
- Radio call-in programs
- Mobile phone data
- Phone company call-data records
- Secondary data (e.g. agency pdf files)
Data Analytics
- Data mining
- Artificial intelligence and deep learning
- Data analysis software (R, Python etc)
- User-friendly apps for data analysis
- Data platforms for the integration of multiple data sets
- Text analytics (including free software provided by social media platforms
Rad Resources
- Together with my colleagues Estelle Raimondo and Jos Vaessen from the World Bank Independent Evaluation Group (IEG) I have developed a complexity checklist. This provides a simple tool for management and evaluators to address questions such as: “does the program have a relatively low or high complexity rating?”, and “which indicators contribute most to the overall complexity score for each dimension?” If the checklist finds a relatively high complexity score, management may decide to commission a complexity-responsive evaluation. This will probably require the incorporation of systems analysis tools to operationalize the complexity concepts.
- Systems Concepts in Action: A Practitioners Toolkit (2009) by Bob Williams and Richard Hummelbrunner.
- See part one and part two of my recent series on complexity and evaluation.

The American Evaluation Association is hosting Digital Data & Technology Week with our colleagues in AEA’s Digital Data & Technology Working Group. The contributions all this week to AEA365 come from working group members. Do you have questions, concerns, kudos, or content to extend this AEA365 contribution? Please add them in the comments section for this post on the AEA365 webpage so that we may enrich our community of practice. Would you like to submit an AEA365 Tip? Please send a note of interest to AEA365@eval.org. AEA365 is sponsored by the American Evaluation Association and provides a Tip-a-Day by and for evaluators. The views and opinions expressed on the AEA365 blog are solely those of the original authors and other contributors. These views and opinions do not necessarily represent those of the American Evaluation Association, and/or any/all contributors to this site.