Hello, AEA365 community! Liz DiLuzio here, Lead Curator of the blog. This week is Individuals Week, which means we take a break from our themed weeks and spotlight the Hot Tips, Cool Tricks, Rad Resources and Lessons Learned from any evaluator interested in sharing. Would you like to contribute to future individuals weeks? Email me at AEA365@eval.org with an idea or a draft and we will make it happen.
Hi, Ben Cohen here. I’m the Director of Evaluation at the Center for Schools and Communities. Do you need to create a quick snapshot of community characteristics for a proposal? Need to put your evaluation data into context? This post describes ways to use R software to automate these tasks. When you use R, it’s possible to integrate a written narrative, information retrieval and adjustment (like the fictional Sam Lowry), and document your work at the same time! I appreciate efficient and well-documented reporting, and R helps a lot.
If you are accustomed to pointing and clicking to make software work, R may seem intimidating to you at first. But if you put some examples to your own use, you might start “clicking” with coding too! The advantage? Re-useable solutions that document your methods in detail!
Below are a few first steps to read existing datasets into R to use for evaluation purposes. While I’m providing a bird’s eye view here, you can find more detailed examples and code to adapt to your needs on my page linked below.
The steps below help you install R and then download, prepare and report on some useful public datasets to put a few fictional evaluation sites into community context.
Hot Tips
- Install R and Posit. OK, this isn’t too hard. Install R first, then Posit (formerly Rstudio). They’re both free! R is a programming language tailored for statistical analysis, and Posit is a user interface that makes using R easier.
- Install packages. Packages are like extra add-ons or modules that are available for many, many different tasks (e.g. making maps, imputing data, using images, etc.).
- Download data. This example uses the ‘tigris’, ‘tidycensus’, and ‘educationdata’ packages to download GIS data and other data. The example code will show you how to specify exactly what you want. Reading the documentation for the packages will teach you even more!
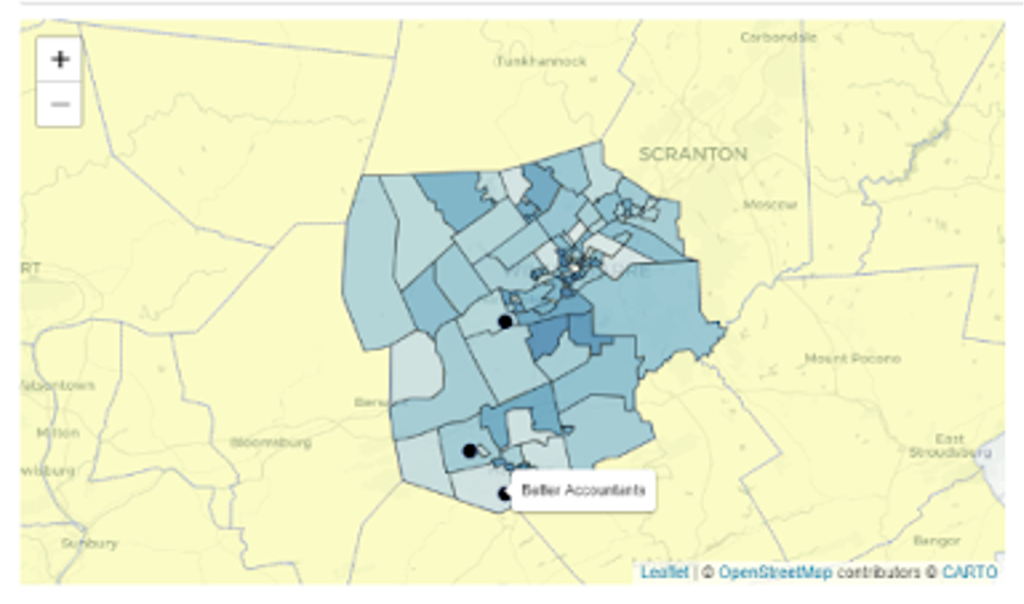
- Make a table and a map. Leaflet is one package that makes (ggplot is another). With a few lines of code, you can layer points and shapes and labels to make a community map of your evaluation sites.

OK, I will admit that if you are new to R you might proceed with some fits and starts. Maybe a bunch. Nonetheless, I encourage you to examine the example code (first rad resource below, give it a try!).
Rad Resources
- Rpubs: This page provides the code for the example described above
- Basic R: Provides simple examples of basic stats in R
- RStudio Cheatsheets: Provides one-pagers describing step-by-step instructions for popular techniques in R
- Using tigris:Shows you how to download shapefiles directly into R
- Using tidycensus: Provides an easy way to download Census data directly into R
- Using leaflet: A basic tutorial for using Leaflet
- R for the Rest of Us: David Keyes provides training in R for new users and non-coders
Do you have questions, concerns, kudos, or content to extend this aea365 contribution? Please add them in the comments section for this post on the aea365 webpage so that we may enrich our community of practice. Would you like to submit an aea365 Tip? Please send a note of interest to aea365@eval.org. aea365 is sponsored by the American Evaluation Association and provides a Tip-a-Day by and for evaluators. The views and opinions expressed on the AEA365 blog are solely those of the original authors and other contributors. These views and opinions do not necessarily represent those of the American Evaluation Association, and/or any/all contributors to this site.
