
Hi, I’m Maryann Durland, Co-Chair of the Social Network Analysis TIG and owner of Durland Consulting, where we specialize in social network analysis. In this post, I show how to enter data into UCINET for a network where you are measuring multiple types of relationships.
An NGO recently wanted to understand how a network of community organizations connected and what each saw as the strengths of the network members. This resulted in 15 different types of collaborative relationships based on the different activities that the network as a whole engaged in. Collaborative activities included collecting data, drafting reports, presenting reports, lobbying, recruiting other members, networking, and planning for the future.
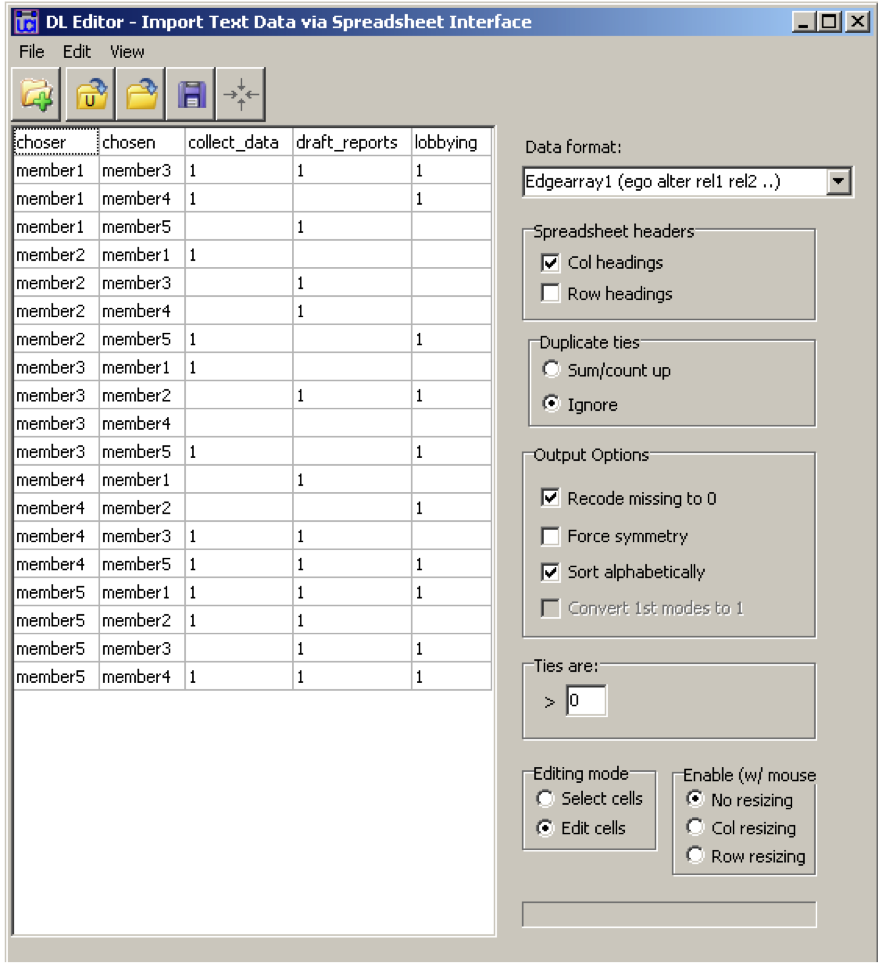
UCINET accepts a variety of data formats. One common approach is to load data from an excel file(.xls, .xlsx, .csv) into a DL format. DL stands for “data language,” and the DL statement at the beginning of the file describes the data, including the number of nodes, labels, and the type of format. UCINET provides a menu-driven process for uploading data and converting to DL. In UCINET, select Data>Import Excel>DL-type formats and copy and paste your data into the DL Editor or open your Excel file using File>Open Excel file. Under Data format, select the appropriate format and other details about your data. For my NGO project, I selected Edgearray1 (ego alter rel1 rel2) to match the layout of my data, which was in the following order: the chooser (ego), the chosen (alter), and the type of collaborative activities (rel1, rel2, …). Though I have column labels, I do not need the labels chooser and chosen,and these will be deleted when I save the file.
Now you will have all relationships saved in one file. When you run measures for the network, you will run them on all relationships at the same time. To visualize the network, you can pull up the data in NetDraw (the network visualization program packaged with UCINET) and code for each relationship and show all of the relationships together in one sociogram or separately:
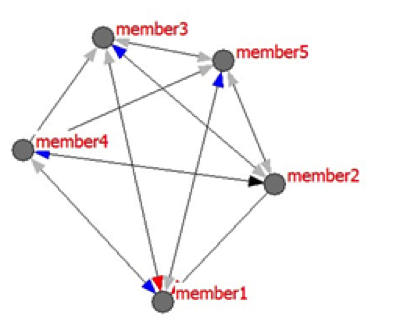
In the map above, the color of the arrows provides information on the type of collaborative activities reported by community organizations. For example, member 2 reported that they draft reports with member 3 (blue arrow), and member 3 reported they collect data with member 1 (red). The black arrow means a member said that they worked on lobbying efforts together. If members indicated multiple relationships, then the arrows are gray.
Rad Resource: UCINET 6 User’s Guide includes a section on importing data that illustrates how to format various DL files—explore here to learn about the possibilities!
The American Evaluation Association is celebrating Social Network Analysis Week with our colleagues in the Social Network Analysis Topical Interest Group. The contributions all this week to aea365 come from our SNA TIG members. Do you have questions, concerns, kudos, or content to extend this aea365 contribution? Please add them in the comments section for this post on the aea365 webpage so that we may enrich our community of practice. Would you like to submit an aea365 Tip? Please send a note of interest to aea365@eval.org. aea365 is sponsored by the American Evaluation Association and provides a Tip-a-Day by and for evaluators.