
My name is Elissa Schloesser, I’m a freelance graphic designer specializing in communicating complex information and ideas. I work specifically with mission-based organization, and partner with a number of evaluators to create communication pieces that summarize evaluation findings for use with funders, potential supporters, and to be more broadly shared with the public.
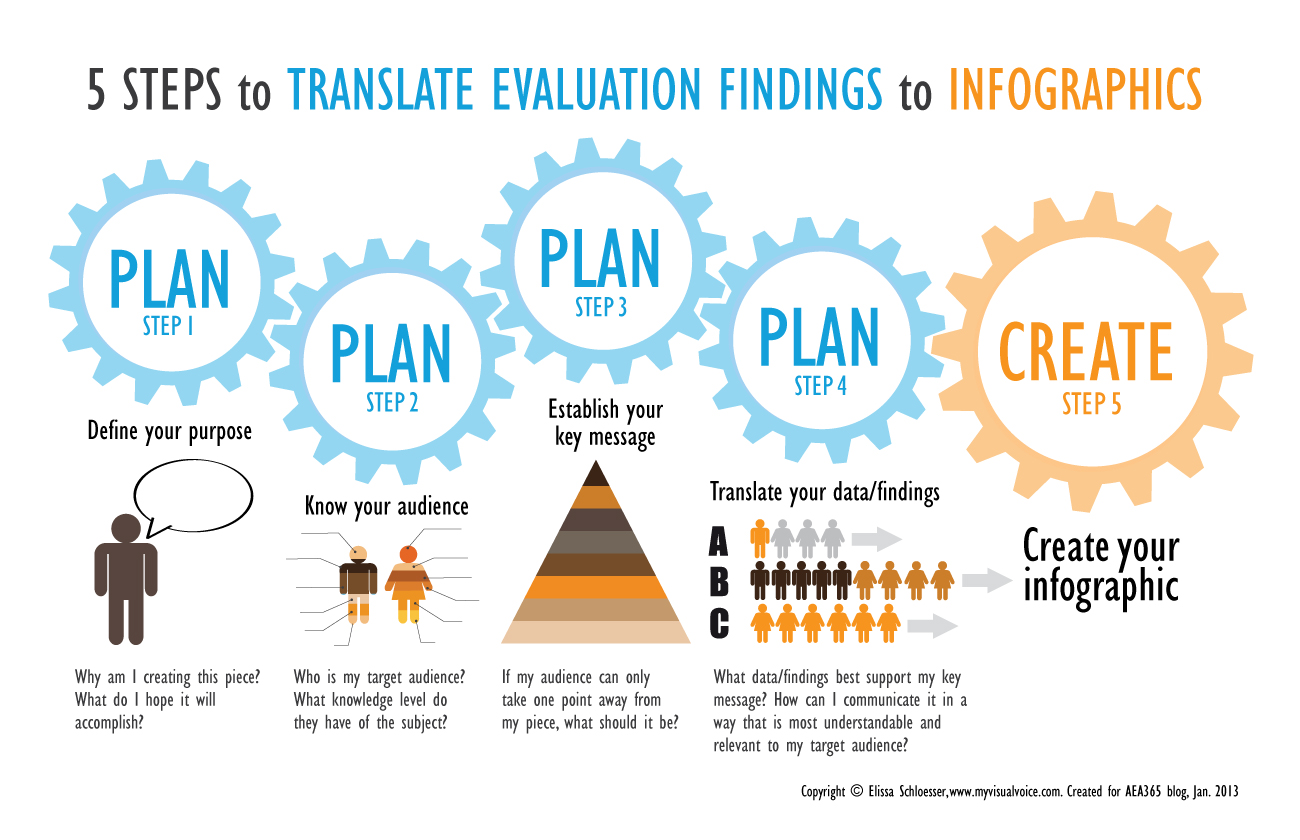
Below are the key steps I use to translate evaluation findings into an infographic. Don’t be afraid if you’re not a designer, I find the most critical design stage comes before putting anything on paper.
Hot Tips:
Step 1. Define your purpose
Why am I creating this piece? What do I hope it will accomplish?
This step is critical. If you can’t answer these questions you should stop before moving onto any other steps.
Step 2. Know your audience
Who is my target audience? What knowledge level do they have of the subject?
This will help you determine how much and what details you will need to include in your piece to make it relevant and understandable. For example, if the piece is targeted at a policy maker who isn’t an expert in your subject area, leave off the acronyms and insider terminology.
Step 3. Establish your key message
If my audience can only take one point away from my piece, what should it be?
Translate your evaluation findings into a key message. Make sure it is clear and included right up front of your piece.
Step 4. Translate your data/findings
What data/findings best support my key message? How can I communicate it in a way that is most understandable and relevant to my target audience?
Put your numbers in context. Make sure it is relevant to your audience and creates a visual image in their mind (i.e. equal to the population of New York City). This pertains to percentages as well (i.e. instead of says 75%, say 3 out of 4).
If your findings are more conceptual (i.e. partnerships are the key to the organization’s success). Draw a simple diagram that shows how various items relate.
Step 5. Create your infographic
Start sketching your concept on paper. It will give you much more freedom to manipulate your idea before moving to the computer. Once moving to the computer, limit your color palette to 2-3 base colors and eliminate any unnecessary borders, shading, or 3-d graphs in your visuals.
Rad Resource: I typically will create infographics or summary pieces using Adobe or Microsoft products, but here are some templates options that I have seen recommended.
Do you have questions, concerns, kudos, or content to extend this aea365 contribution? Please add them in the comments section for this post on theaea365 webpage so that we may enrich our community of practice. Would you like to submit an aea365 Tip? Please send a note of interest to aea365@eval.org. aea365 is sponsored by theAmerican Evaluation Association and provides a Tip-a-Day by and for evaluators.
Pingback: La ficción del desarrollo | "TripleAD": Aprendiendo a Aprender para el Desarrollo
Nice work!
We are using infographics with the Kellogg Foundation and the Minority Subrecipient Grant Office for tobacco prevention in Arkansas
Keep up the good work – planning is key
– David
Pingback: Marc Wheeler and Salem Valentino on Using Infographics to Communicate Evaluation Findings: the Experience of Two Evaluators · AEA365
Hi Elissa, Thanks for this post! We are really wanting to explore infographics here at Big Brothers Big Sisters of America.
I’ve checked out the sites you recommended. Do these only create images to embed online? They don’t give you the ability to save your creation as a picture file?
Thanks!