
Greetings fellow evaluators! We are Veena Pankaj, Kat Athanasiades, Deborah Grodzicki, and Johanna Morariu from Innovation Network. Communicating evaluation data effectively is important—it can enhance your stakeholders’ understanding of evaluative information and promote its use. Dataviz is an excellent way to communicate evaluation results in an engaging way!
 Today’s post provides a step-by-step guide to creating effective, engaging dataviz, using Innovation Network’s visual State of Evaluation 2016 as an example. State of Evaluation 2016 is the latest in our series documenting changes in evaluation capacity among nonprofits across the U.S.
Step 1: Identify your audience. For State of Evaluation, our audience was nonprofits, foundations, and their evaluators across the U.S.
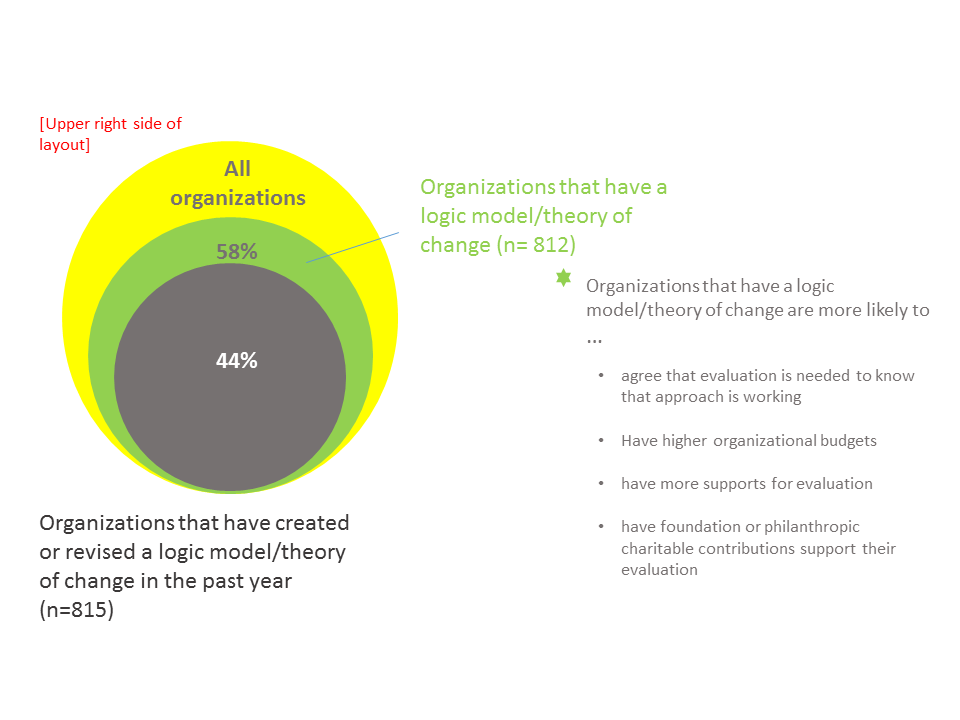
Step 2: Select key findings. Analyze your data. Which findings are most relevant to your study and your audience? As evaluators, this is the easy part! We found that organizations funded by philanthropy are more likely to measure outcomes, and thought that would be interesting to our readers.
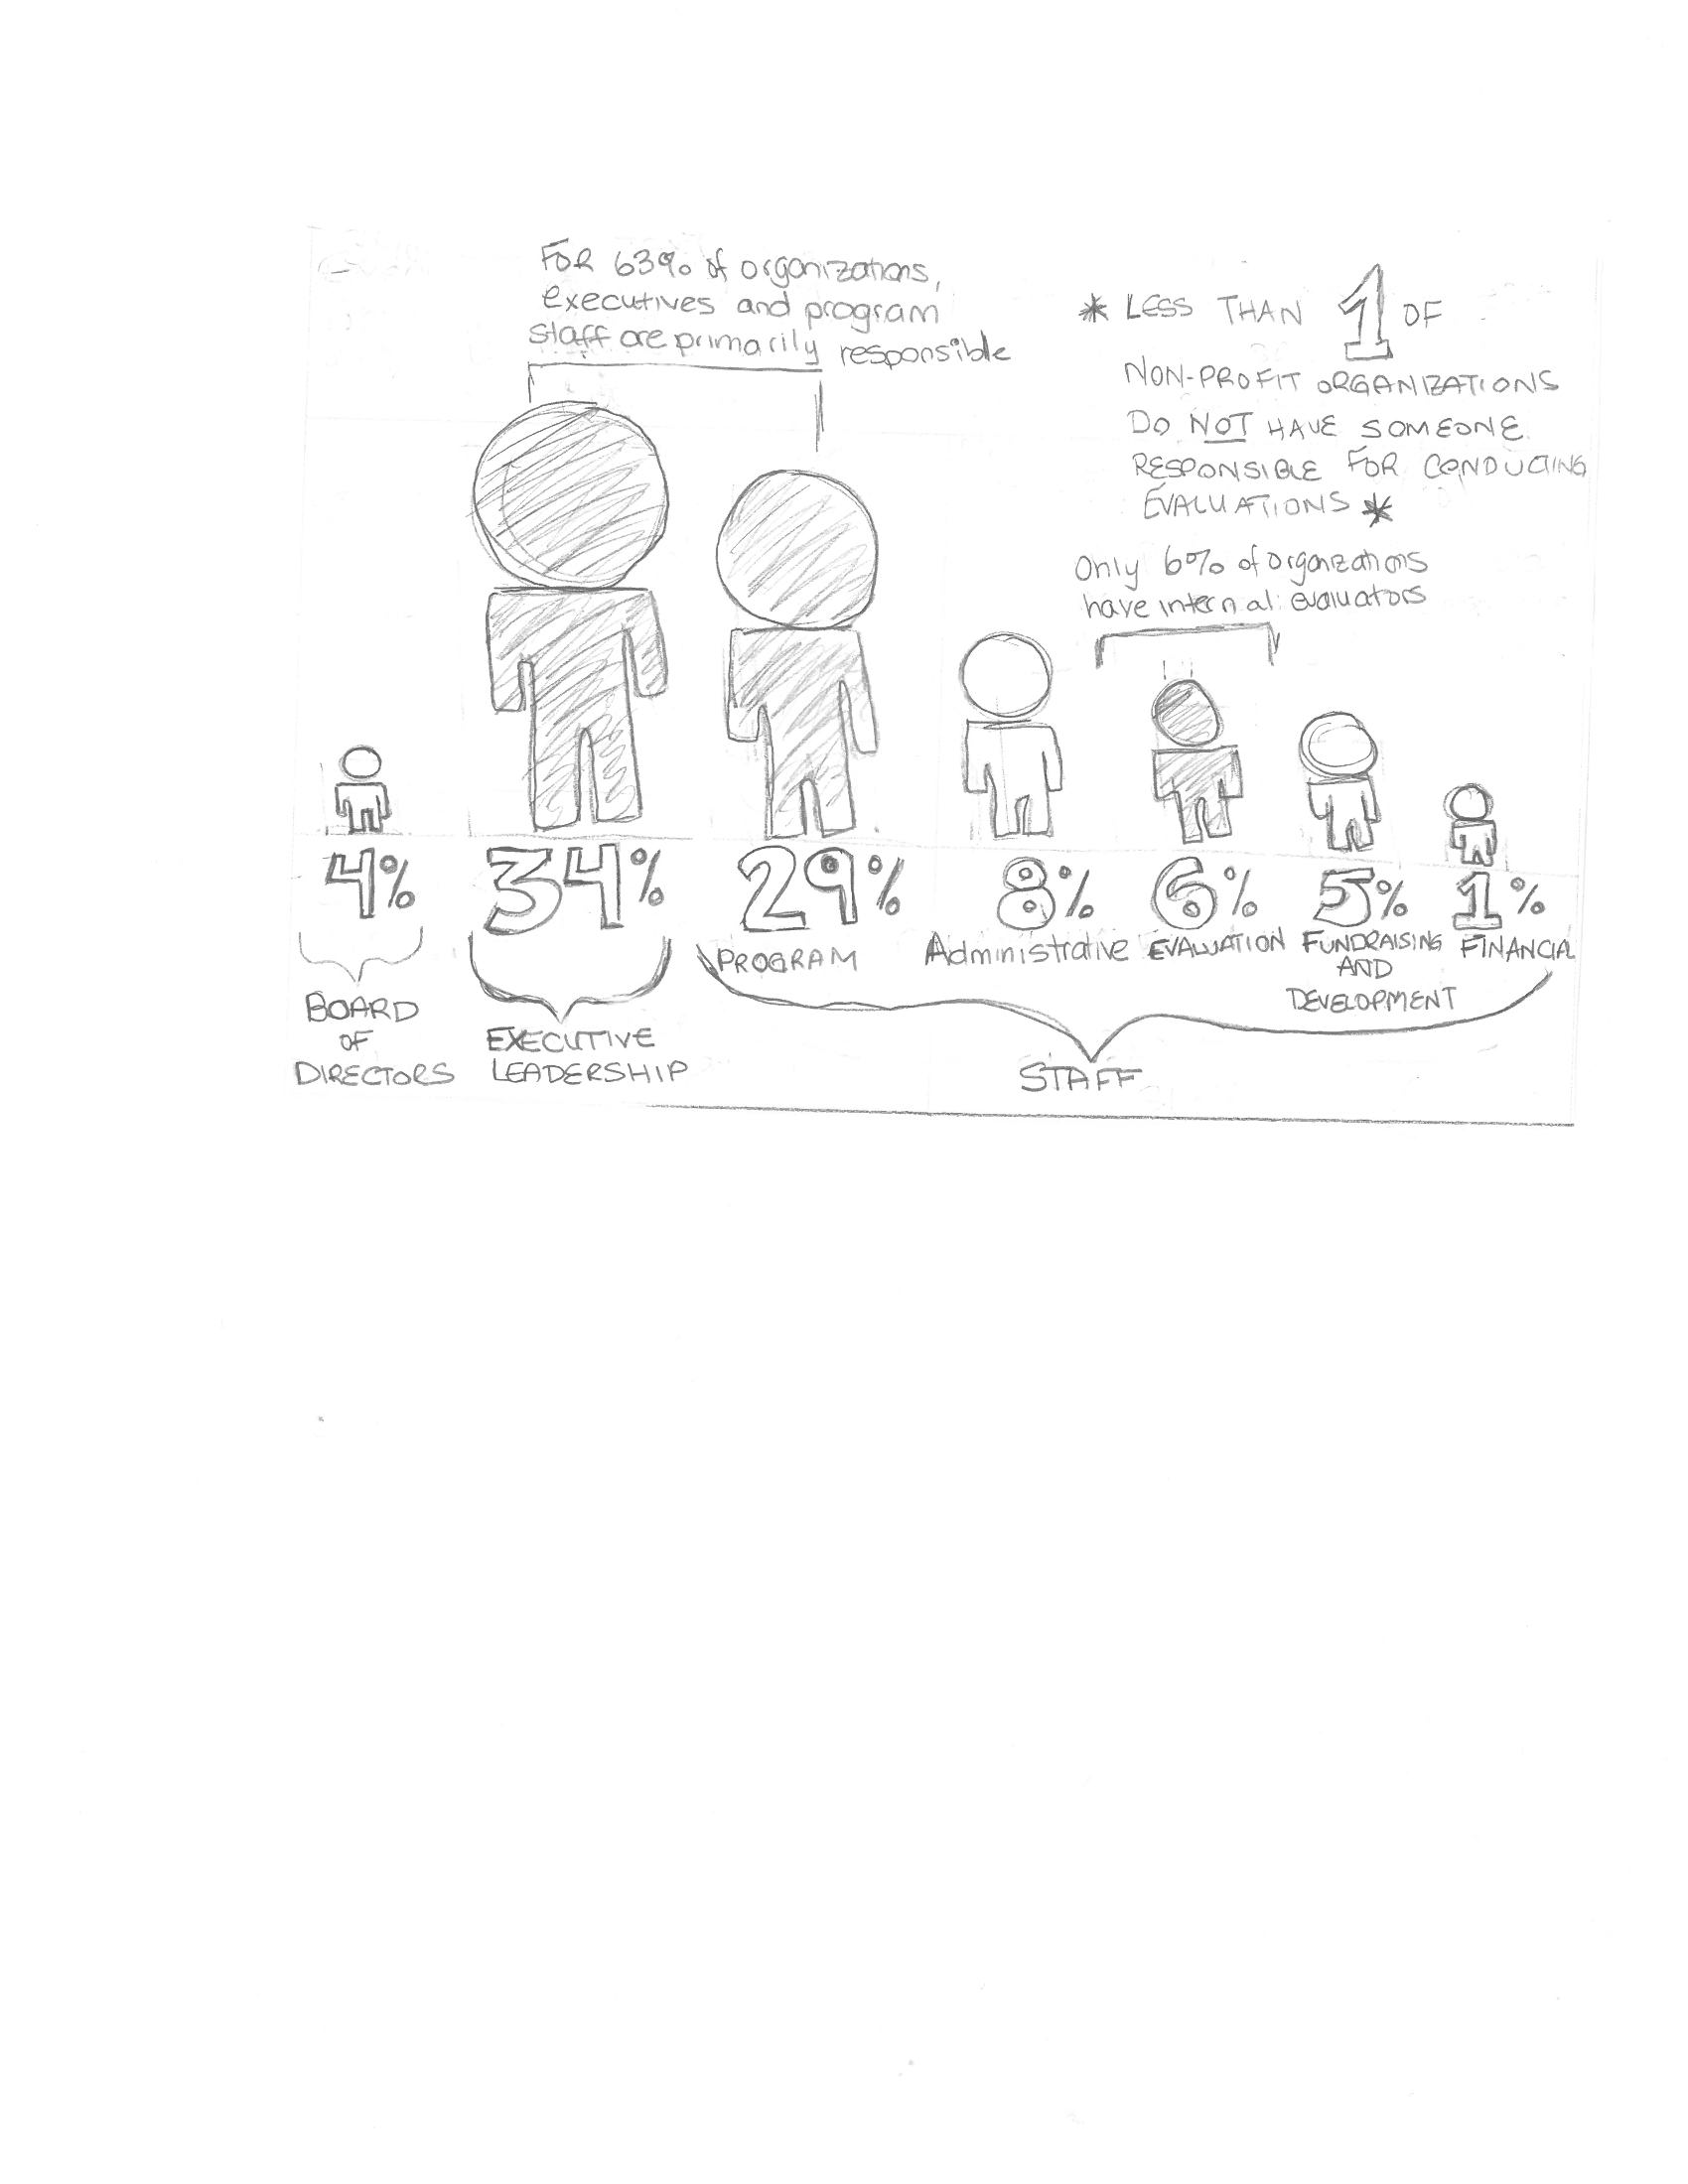
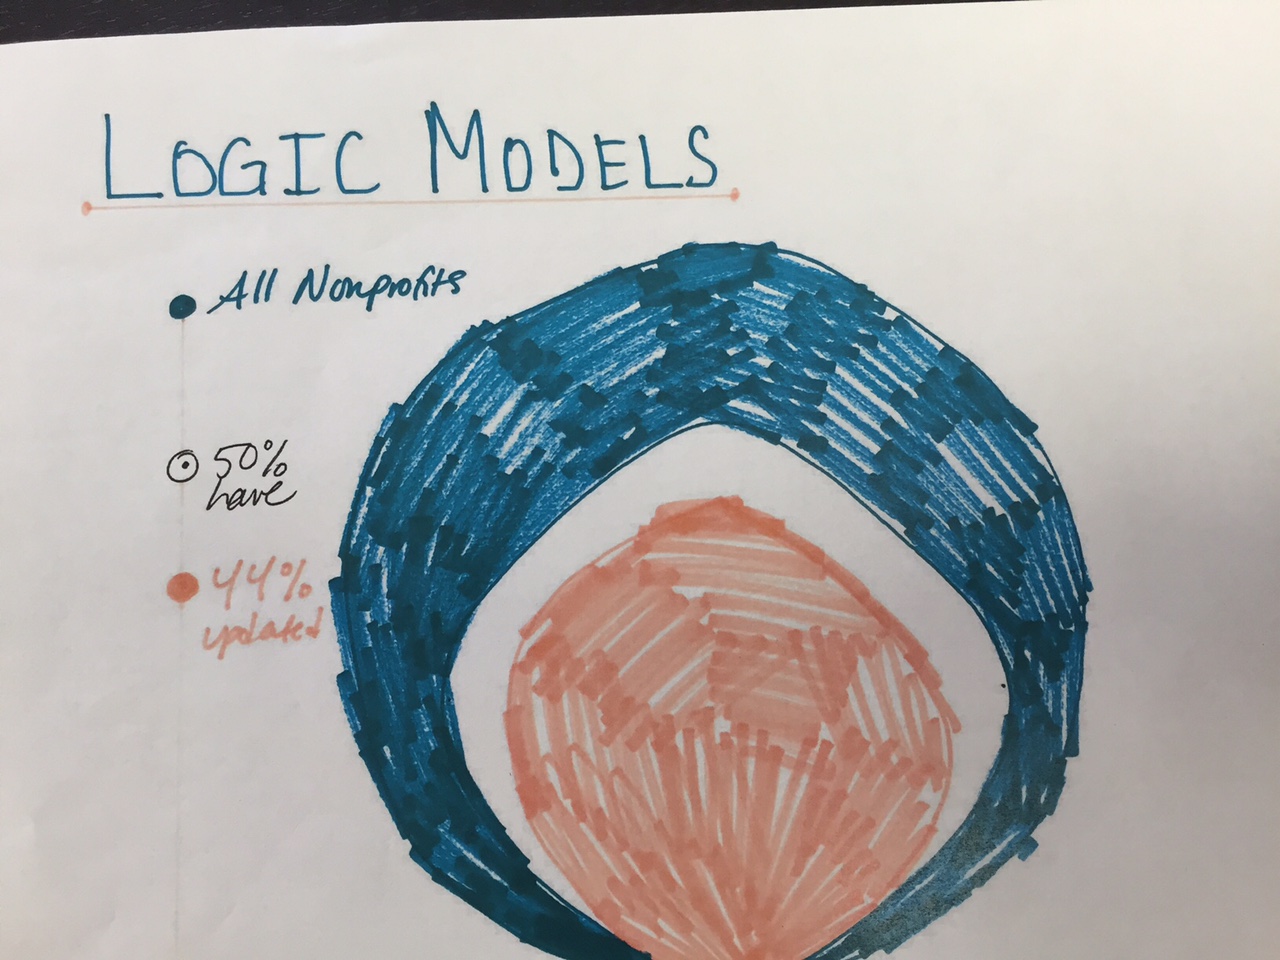
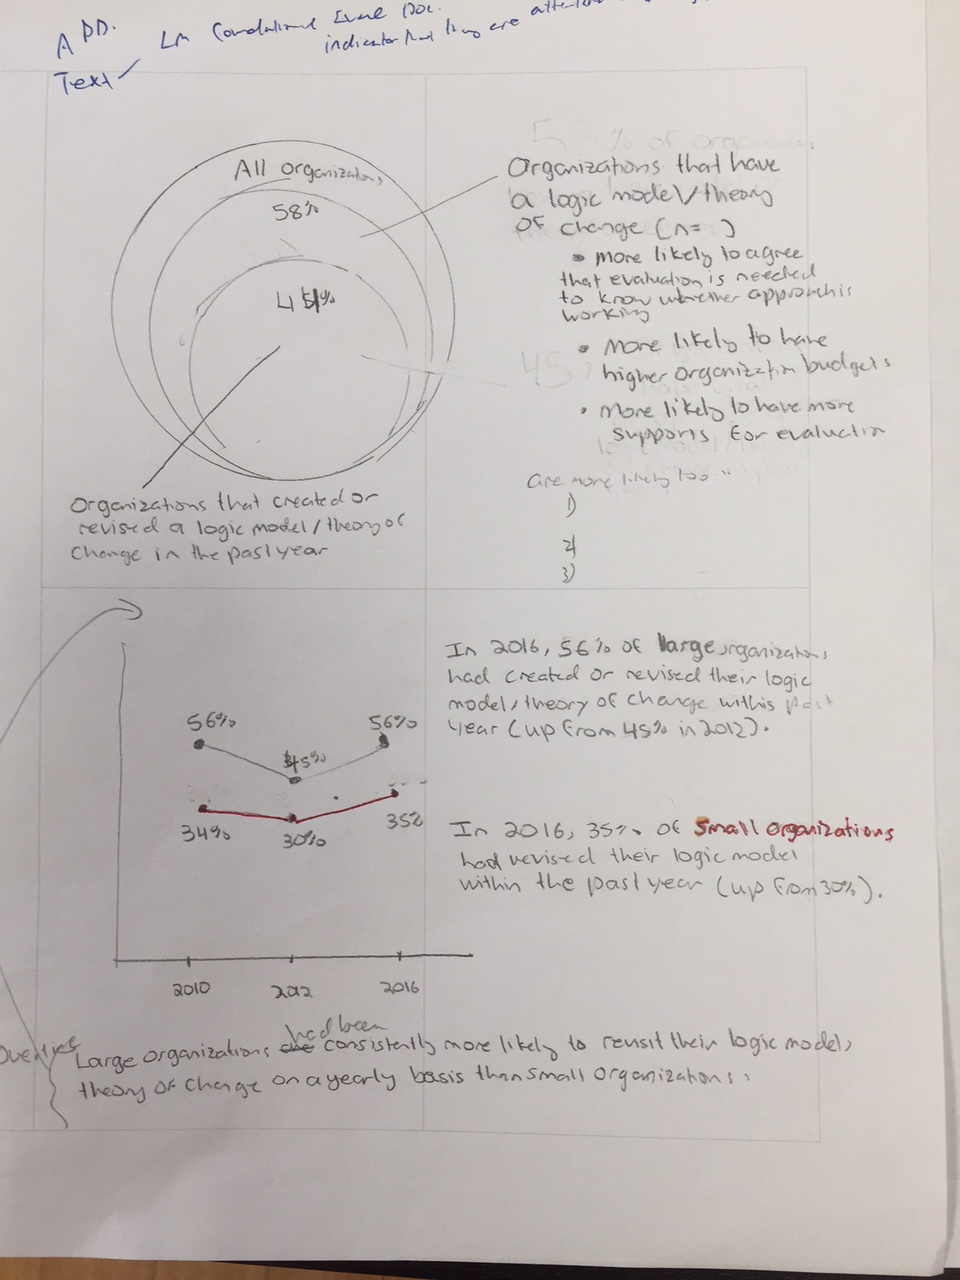
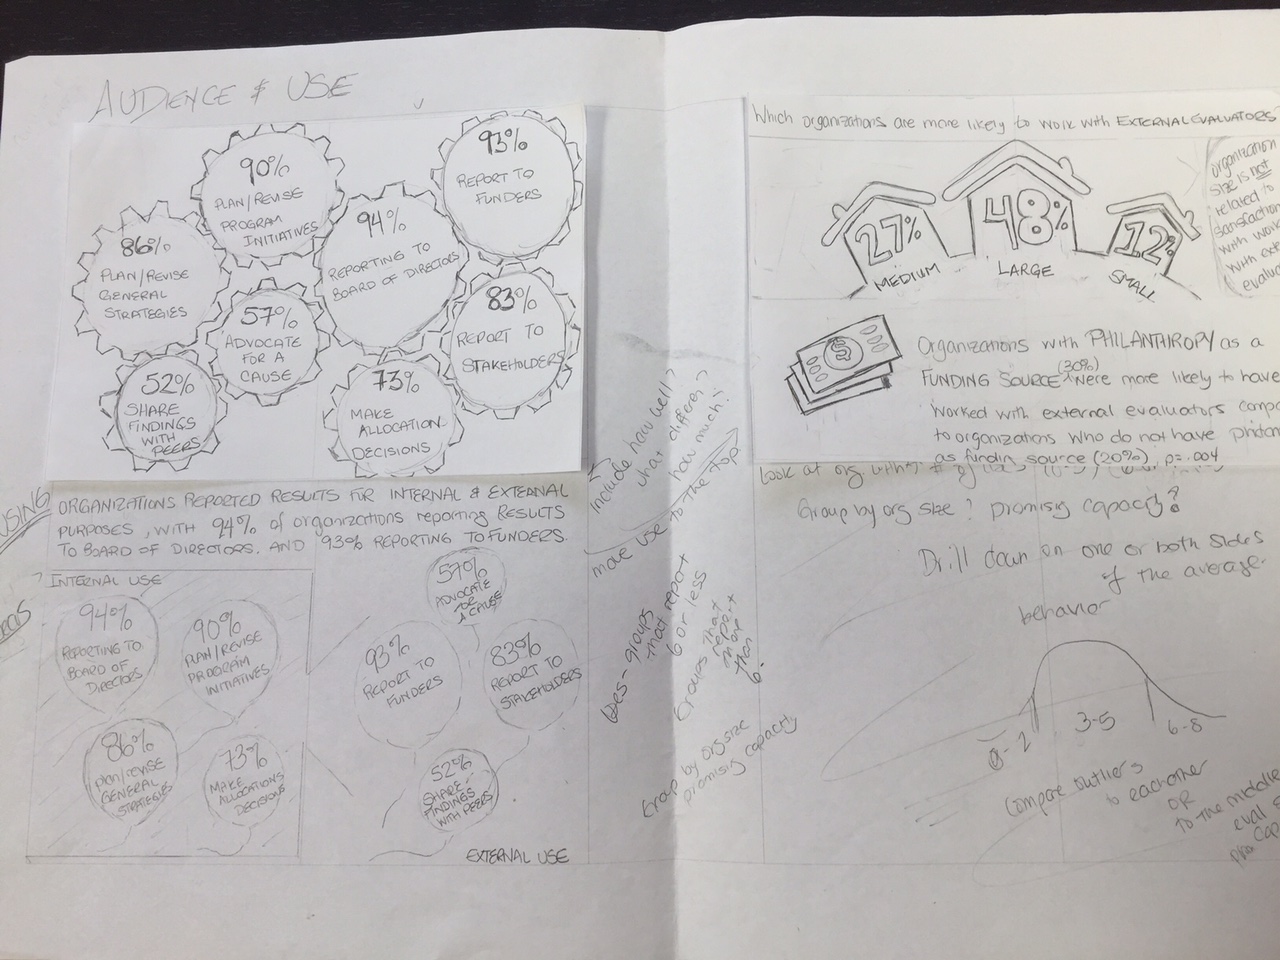
 Step 3: Grab paper and pencil. Start drawing different ways to display your data. What images or concepts does your data evoke? Thinking beyond generic chart formats may help your audience better understand the meaning behind the data. Brainstorming as a team can really help keep creative ideas flowing!
Step 4: Gather feedback. Show your initial sketches to others and get their first impressions. Ask questions like:
- What does this visualization tell you?
- How long did it take you to interpret?
- How can it be tweaked to better communicate the data?
Third party feedback can provide additional insights to sharpen and fine-tune your visualizations.
Step 5: Think about layout and supporting text. Once you’ve selected the artistic direction of your visualization, it’s time to add supportive text, label your visualization features, and think about page layout.
Hot Tip: For inspiration, check out Cole Nussbaumer’s Storytelling with Data gallery.
Step 5. Digitize your drawings. If you are working with a graphic designer, it’s helpful to provide them with a clear and accurate mock-up of what you want your visualization to look like. We worked with a designer for State of Evaluation, but for the bulk of dataviz needs this is unnecessary. Digitizing is accomplished by translating your initial renderings into a digital format. Basic software such as PowerPoint, Word, or Excel is often all you need.
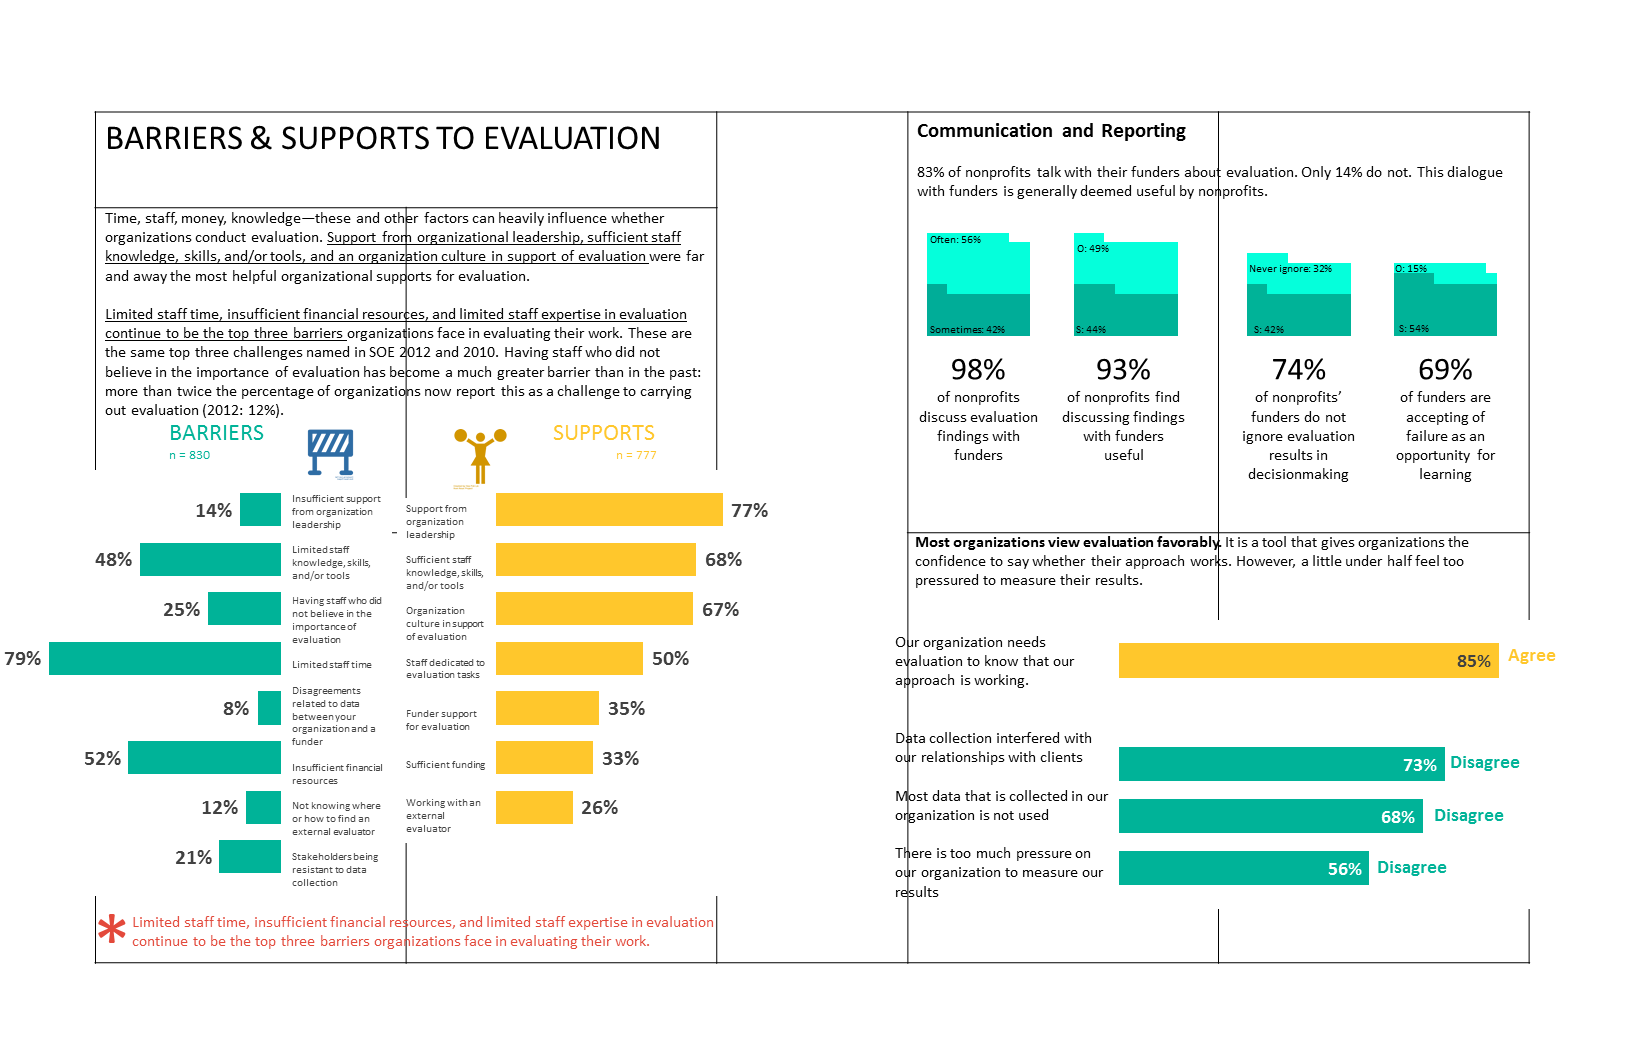
Rad Resource: Interested in seeing how our dataviz creations evolved? Check out State of Evaluation 2016!
The American Evaluation Association is celebrating Data Visualization and Reporting (DVR) Week with our colleagues in the DVR Topical Interest Group. The contributions all this week to aea365 come from DVR TIG members. Do you have questions, concerns, kudos, or content to extend this aea365 contribution? Please add them in the comments section for this post on the aea365 webpage so that we may enrich our community of practice. Would you like to submit an aea365 Tip? Please send a note of interest to aea365@eval.org. aea365 is sponsored by the American Evaluation Association and provides a Tip-a-Day by and for evaluators.
Pingback: More on visitor reporting: data visualisation – Museums | Digital | Research | Learning