
Hi! We are Sara Vaca, independent consultant (EvalQuality.com) and Creative Advisor of this blog and Joseph Barnes (Senior Partner at ImpactReady). Today we are going to talk about the work ImpactReady is sponsoring to develop new ideas for using creativity and Dataviz to celebrate the International Year of Evaluation.
Like many evaluators, we have been really inspired by the energy and events that have circulated around EvalYear, and we wanted to find a way to make our contribution to coming-together. After exploring several opportunities, we decided to combine our love of sharing the things we have learnt about practicing evaluation with exploring the exciting new frontier of visualization.
Increasing access to broadband and awareness of how important user experience (UX) is to utilization means that there is a growing interest in Data Visualisation (Dataviz) in the evaluation community. But few of us are yet practicing it as much as we would like to. To help things along, we are attempting to create one new example of evaluation visualization each month throughout EvalYear.
With each of these products, we are seeking to achieve three aims:
To promote the dialogue within the evaluation community;
To foster deeper knowledge of evaluation theories; and
To have fun learning.
Rad Resources: Our first releases include:
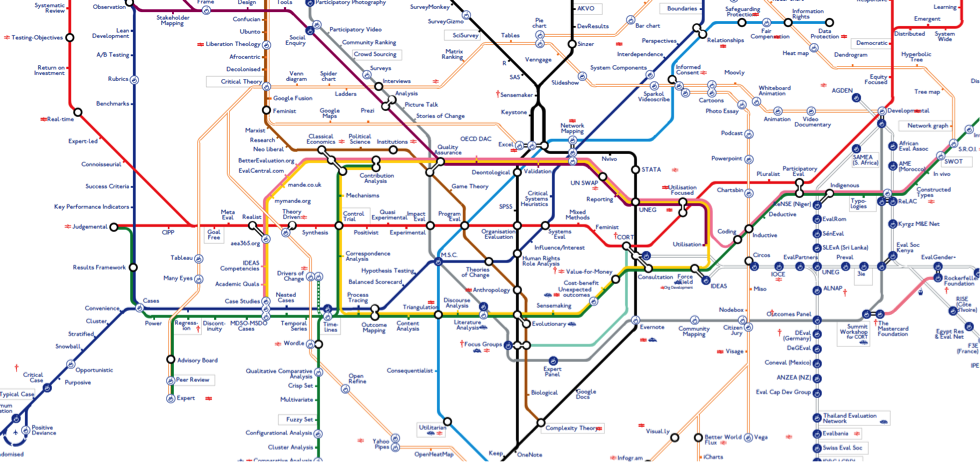
- Evaluation Metromap: Joseph put together this ‘underground map’ of evaluation where each line gathers the most representative of various evaluation aspects such as theories, approaches, techniques, actors, paradigms, etc.
- What type of evaluator are you? Test: we created this non-scientific multiple-choice test to help evaluators discover if they embrace the paradigm they think they do. We invite you to try it (and help us improve it)!
- What is good (and bad) evaluation (infographic): after having done many meta-evaluations, we have seen many common mistakes – including in our own work. We created this infographics as a way to provoke ourselves, and our fellow evaluators, to be as clear as possible about what we think ‘good’ really looks like.
- Ethical issues in evaluation: Ethics is often a forgotten element in evaluation. We wanted to highlight typical controversial moments in evaluation to acknowledge them.
Rad Resources: You are welcome to visit the full project at EvalYear.com, and we have more releases coming soon. Here is a sneak peak:
- A decision tree for helping with the Evaluation design
- A motion picture explaining what evaluation really is.
- A Gender dashboard
- An evaluation coffee table e-book
- And others!
Keep tuned to know more, and as usual, feel free to comment and contribute with your thoughts to help us learn more!
The American Evaluation Association is celebrating Data Visualization and Reporting (DVR) Week with our colleagues in the DVR Topical Interest Group. The contributions all this week to aea365 come from DVR TIG members. Do you have questions, concerns, kudos, or content to extend this aea365 contribution? Please add them in the comments section for this post on the aea365 webpage so that we may enrich our community of practice. Would you like to submit an aea365 Tip? Please send a note of interest to aea365@eval.org. aea365 is sponsored by the American Evaluation Association and provides a Tip-a-Day by and for evaluators.