I am Susan Kistler, the Executive Director of the American Evaluation Association and the owner of iMeasureMedia. I usually don’t mention the latter on aea365, but today I want to be clear that I’m wearing my iMeasureMedia hat since AEA does not endorse particular products or services.
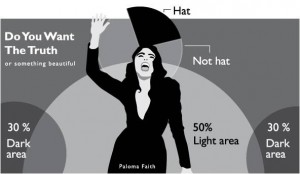
Last week, at Evaluation 2012, I gave a presentation on 25 low-cost/no-cost tech tools for Data Visualization and Reporting (thank you to the DVR TIG for its sponsorship of the session). With Paloma Faith crooning Do You Want the Truth or Something Beautiful in the background, we opened the session and took a look at tools that hopefully help us to merge truth and beauty.
 Rad Resource: Download the full slidedeck from the AEA public eLibrary here.
Hot Tip: Consider downloading the pdf version where the notes are more readily accessible – the notes include the URL links for each item, cost information, and tips.
Rad Resources: So, what tools did we explore?
1. VisualJournalism.com (and Paloma Faith – Do you want the truth or something beautiful?)
2. EndlessYouTube
3. Official Seal Maker
4. Wallwisher
5. Amazing Multicolor Search Engine
6. ColorZilla
7. Office Timeline
8. amaztype
9. SnagIt
10. Intentional Data Visualization & Reporting Blog
11. Poll Everywhere
12. Pinterest
13. aea365
14. Prezi
15. Tagxedo
15. Tagxedo
Here are a few bonus items, included in the slide deck with notes:
16. CartoDB
17. Storify
18. PicturePalette
19. Color Palette Generator
20. Lovely Charts
21. fiverr
22. Pixton
23. Tableau Public
And, here are tools recommended by attendees at the session, also included in the slide deck with links and notes – and we’re soliciting aea365 posts from each one in hopes of learning more.
24. visual.ly
25. Photosynth
26. GIMP
27. amCharts
28. PDFill
Stay tuned for individual demonstrations on a number of these in the coming weeks, and thank you to all who attended the session.
The above represents my own opinions, and not necessarily that of AEA. Do you have questions, concerns, kudos, or content to extend this aea365 contribution? Please add them in the comments section for this post on the aea365 webpage so that we may enrich our community of practice. Would you like to submit an aea365 Tip? Please send a note of interest to aea365@eval.org. aea365 is sponsored by the American Evaluation Association and provides a Tip-a-Day by and for evaluators.


Pingback: DVR Week: Ann Emery on the Dataviz Hall of Fame for Evaluation · AEA365
Pingback: aea365 « Reach Forward
Pingback: Susan Kistler on Fiverr and Free Coffee Break Webinars and an Amazing Cup of Cappuccino · AEA365
Janelle, I’ll connect via email, and thanks so much for the additional info Simon!
Pingback: 25 Low Cost Tech Tools for Data Visualization and Reporting | Pacific AIDS Network
Pingback: What Can Evaluators Learn From Politics? | On Top Of The Box Evaluation
Hi Susan,
I would like to do an interview of you for my program evaluation class. I am currently pursuing a Masters in Public Policy, and my concentration is policy informatics. Your posting is extremely relevant to my interests and I would like to learn more about data visualization and reporting in addition to your story. If you are interested and available for a brief interview, please e-mail me at jhouston@asu.edu.
Thanks!
Thanks for posting this Susan. I was at the session and really appreciated the fast pace at which you went through these. Quite refreshing.
Lovely charts is also available online and on desktop, not just ipad. Sadly none of the options are free, but there’s a free trial. http://lovelycharts.com/