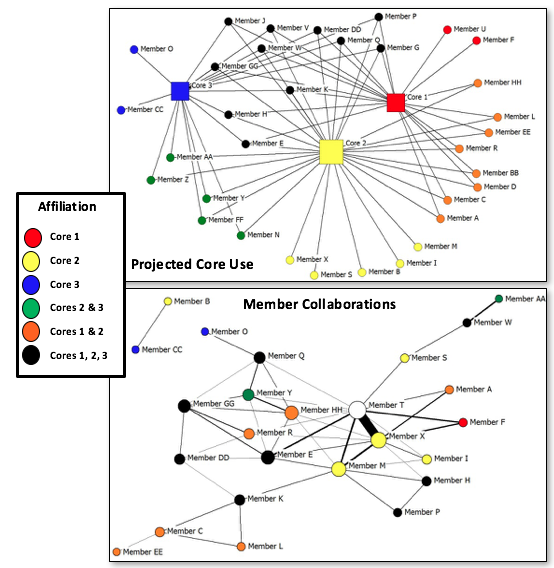
My name is Jessica Wakelee, with the University of Alabama at Birmingham. As evaluators for our institution’s NIH Clinical Translational Science Award (CTSA) and CDC Prevention Research Center (PRC), one of our team’s tasks is to find ways to understand and demonstrate capacity for collaborative research. This is a great need among the investigators on our campus applying for grant funding or preparing progress reports. One of the tools we have found helpful for this purpose is Social Network Analysis (SNA).
To accomplish an SNA for a particular network of investigators, typically, we will collect collaboration data using a web-based survey, such as Qualtrics, unless the PI already has existing data such as a bibliography that can be mined. We ask the PI to provide us with a list of network members, and send each one a survey asking them to check off collaborations they’ve had in the past 5 years with the other listed investigators. The most common collaborations include things like co-authored manuscripts, abstracts/presentations, co-funding on grants, co-mentorship of trainees, and other/informal scientific collaborations, but we also tailor questions to meet the interests of the investigator/project. The result is a graphical depiction of the network as well as a variety of statistics we can use to provide context and tell a compelling story.
Hot Tip:
What are some of the ways we’ve found work best for describing translational research collaborations using SNA?
- Reach of a center or hub to partners or clients
- Existing collaborations among investigators, which can be compared at baseline and later time points
- Increasing strength or quality of collaborations over time (i.e. pre-award to present)
- Current/projected use of proposed scientific/technology Core facilities
- Demonstrate multidisciplinary collaborations by including attributes such as area of specialty
- Demonstrate mentorship and sustainability by including level of experience/rank
Lessons Learned:
- To the extent possible, make the data collection instrument simple: Use check boxes and a single open text field for comments to provide context. This works well and minimizes the need for data cleaning/formatting.
- While the software can assume reciprocity in identified relationships among investigators, having a 100% response rate allows for the most complete and accurate data. We have found it helps to have the PI of the grant send out a notice to collaborators to be expecting our survey invitation to boost the response rates.
- Because we often prepare these analyses for grant proposals, it is important to allow time for data collection and avoid the “crunch time” when investigators are less likely to respond. The amount of time needed depends on the size of the network, but we find that about 4-6 weeks lead time works well.
Rad Resource:
- UCINET/NetDraw is the gold standard software for SNA, but there are free alternatives (e.g. “NodeXL”, an add-on to Excel) and free trials are available.
The American Evaluation Association is celebrating Translational Research Evaluation (TRE) TIG week. All posts this week are contributed by members of the TRE Topical Interest Group. Do you have questions, concerns, kudos, or content to extend this aea365 contribution? Please add them in the comments section for this post on the aea365 webpage so that we may enrich our community of practice. Would you like to submit an aea365 Tip? Please send a note of interest to aea365@eval.org. aea365 is sponsored by the American Evaluation Association and provides a Tip-a-Day by and for evaluators.


Would you strongly recommend UCINET over all the other SNA software programs?