Greetings, I am Cindy Weng, a bio-statistician II employed at Pediatrics Research Enterprise at Department of Pediatrics at the University of Utah. This post was written together with my colleagues Chris Barker, SWB project manager and Larry George, statistician at Problem Solving Tools.
I learned about this methodology through a project assigned by ASA Statistics Without Borders (SWB) in 2011. The goal of this project was to analyze under 5 years (U5) mortality of children before (“baseline”) and after (“endline”) humanitarian aid given at Afghan refugee Camps in Pakistan. Survival analysis was used to estimate the probability distribution of age at death from current status and admissible age-at-death data. Inadmissible ages at death placed the date of death after the survey dates!
The International Rescue Committee survey data contained inadmissible ages at deaths, so the Kaplan Meier nonparametric maximum likelihood estimator was, used along with estimators from current status data only.
Tips:
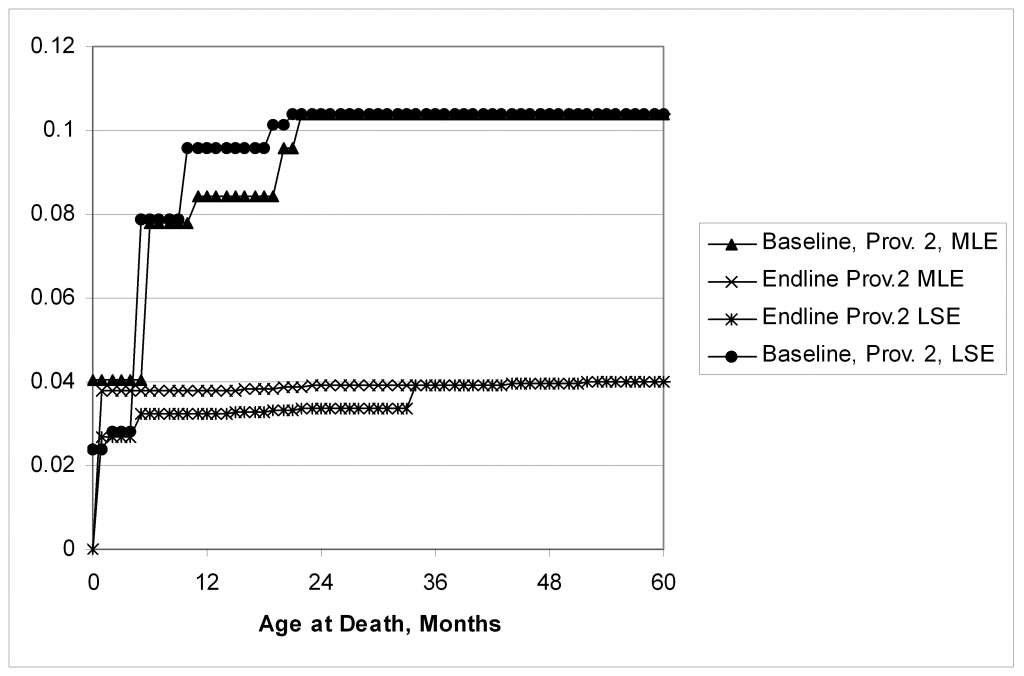
- Maximum likelihood and least squares estimators differ. We estimated survivor functions from baseline and endline surveys. “MLE” and “LSE” denote maximum likelihood estimation and least squares estimates. They don’t always agree, because the methods are different approaches to estimation. In particular, LSE does not respond to noise. If noise is not uniform across the sample, LSE might be incorrect. The MLE takes noise into consideration. The MLE estimates in the figure are from current status data. They agreed pretty well with the Kaplan-Meier estimators from admissible ages at deaths.
Lessons learned:
- Survey data is not always what is expected. Surveys should have cross-checking validation opportunities. Current status data provided the opportunity to make two estimates of survivor functions.
- Expect unexpected outcomes. The baseline U5 estimates are over 10%, and the endline U5 estimate is approximately 4%. Pakistan’s country U5 is 8.7%. The endline U5 estimates standard deviation is less than 0.5%. The apparent reduction in U5 appears to be primarily a reduction in deaths after infant mortality in the first year. Infant mortality was almost 4% before and after.
Resources:
- Problem Solving Tools
- Marcorin and Abackerli’s article: Field Failure Data: an Alternative Proposal for Reliability Estimation
The American Evaluation Association is celebrating Statistics Without Borders Week. The contributions all week come from SWB members. Do you have questions, concerns, kudos, or content to extend this aea365 contribution? Please add them in the comments section for this post on the aea365 webpage so that we may enrich our community of practice. Would you like to submit an aea365 Tip? Please send a note of interest to aea365@eval.org. aea365 is sponsored by the American Evaluation Association and provides a Tip-a-Day by and for evaluator.

