My name is Susan Kistler, the American Evaluation Association’s Executive Director and perpetual aea365 Saturday contributor
Lessons Learned: Two pieces of background information will help you wade your way through the following post if you aren’t familiar with the topic.
- Twitter: You’ve likely heard of Twitter – the microblogging platform on which users share conversation and resource links in 140 characters or fewer. Want to learn more? Read the Twitter for Dummies on the blogtips blog. It covers everything from ‘why tweet’ to the technology that makes it all work. Want to get started? Sign up for a Twitter account and follow @aeaweb on twitter.
- Hashtag: Hashtags are used across many social media platforms to help people find topical content – they are a keyword or acronym preceded by a “#”. As an example, people tweeting from Evaluation 2012 used #eval12 as the hashtag.
Rad Resource – visual.ly: The visual.ly* website includes a free tool for creating an infographic based on a specific twitter hashtag.
Lessons Learned – the good:
- It is eye catching and creates visual interest in the content
- It is easy to make – the two here each took fewer than 60 seconds
- It provides a quick look at the volume of use of a hastag
Lessons Learned – the bad:
- Your final infographic will look almost exactly like the one above. You can’t change any part of the template. I made another one today (scroll down) so you could see what changes and doesn’t.
- Your infographic includes no qualitative information to help you to understand the quality and nature of the exchange, and not just the quantity.
- See @JBZantua referenced below? He was not part of the larger conversation about program evaluation and his account is heavily dedicated to finding followers – you have no control over who uses a hashtag!
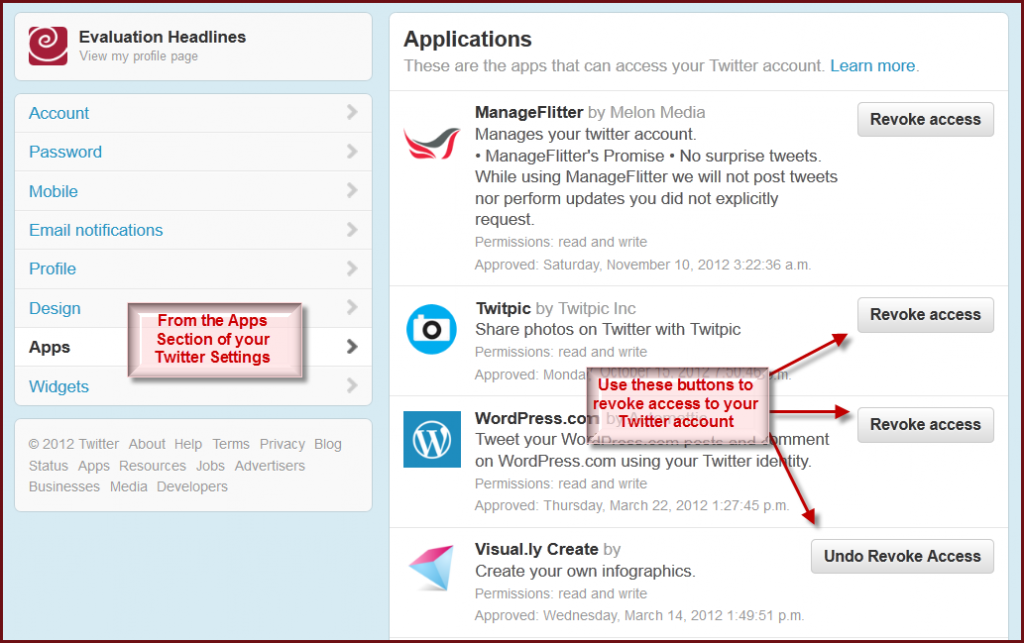
- To use visual.ly, you need to give visual.ly limited access to your Twitter account (this is fairly common, but scary) – immediately after creating your graphic, I strongly recommend revoking access.
Lessons Learned – the ugly: Take a close look.
*visual.ly is primarily an infographics library and marketplace where people with information to share can find infographic designers with whom to contract to create a design. In a future post, I’ll return to discussions of (a) infographics (the good, the bad, the ugly), and (b) the marketplace concept.
Do you have questions, concerns, kudos, or content to extend this aea365 contribution? Please add them in the comments section for this post on the aea365 webpage so that we may enrich our community of practice. Would you like to submit an aea365 Tip? Please send a note of interest to aea365@eval.org. aea365 is sponsored by the American Evaluation Association and provides a Tip-a-Day by and for evaluators.


We are currently working with Visual.ly as a client of their marketplace! Let me know if you want more information on how it’s going for us. I’m interested to hear what you think about the marketplace idea.
-Sarah
srand@uchicago.edu