I’m Susan Kistler, AEA’s Executive Director, and I contribute each Saturday’s post to aea365. At the annual conference earlier this month, I had the opportunity to attend the Data Visualization and Reporting group’s innovative business meeting. They filled the meeting with short Ignite presentations interspersed with fun activities (well at least to evaluators!).
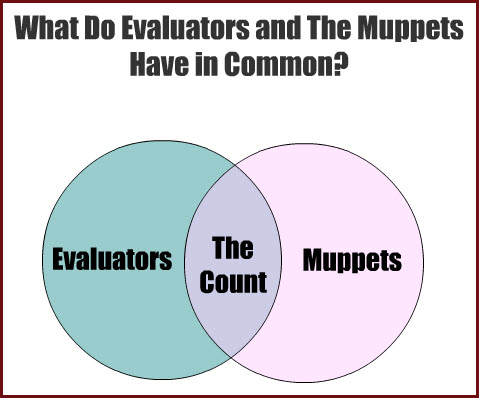
Lesson Learned: Venn diagrams can be a riot. Those in attendance were asked to fill in a blank Venn diagram showing the intersection of two groups – here was the entry to which I contributed:
Hot Tip: Now it’s your turn! Win a great book donated by our wonderful colleagues at SAGE Publications– we’ve got 10 current releases from which you can choose! How? Just enter your best Venn Diagram suggestion in the comments section for this post, like this:
Left: Evaluators
Right: Muppets
Intersection: The Count
The Venn should (a) be of interest to evaluators in some way – focus on data, methods, theories, the conference, our journals, evaluators, stakeholders, etc. – and (b) be funny – no serious explorations of intersection evaluation theories this week, we’re taking a break and having a laugh over a long holiday weekend.
We’ll draw two winners at random from all those submitted meeting both criteria, loosely defined. No more than one per person please. And, we’ve got a small group of judges who may mock-up the very best for the AEA newsletter. You don’t need to be a member to play, but be sure to put your full name and email in the comment form so we can notify you if you win (don’t worry, the email doesn’t show publicly).
If you are reading this via email or RSS, click back to the post on the aea365 website and scroll down to find the comment form.


Left: Evaluators
Right: Injured Baseball Players
Intersection: Benchmarks
Left: Evaluator
Right: Name on a bathroom stall
Intersection: For a good time, call…
I am going to break the rules and go with three circles.
Right: Evaluations
Left: Gardeners
Top: Teenage gossip
Intersection: Dig up dirt
Left: Evaluators
Right: Flashers
Center: Reveal
Left: Evaluation
Right: Buying a car
Intersection: Assessing (potential) impact
Left: Evaluators
Right: Microphones
Center: Feedback
I will revisit an idea (borrowed from Jeffrey Zeldman, designer and blogger and Jacob Harris, NY Times) that I used in my AEA talk:
Left: Things that are curiously popular
Right: Things that create visual confusion
Intersection: Mullets or Wordles
Left: Evaluators
Right: Five-Year Old Kids
Intersection: People who are constantly asking the question why.
Second entry playing off of Susan’s original post:
Left: Evaluators
Right: Muppets
Intersection: Evaluand = Songs about rainbows.
Left: Bean Counters
Right: Baked Beans
Intersection: The Kitchen
As in, “Stay out of the (policy) kitchen if you can’t take the heat.”
Left: Evaluators
Right: Winnie the Pooh
Intersection: Sharing is caring
What do qualitative data and quantitative data have in common?
Left: Qualitative Data
Right: Quantitative Data
Intersection: EVALUATORS!
Left: Regression Coefficients
Right: Ethnography
Intersection: Uh-Oh
What do brain researchers and politicians have in common?
Left: brain researchers
Right: politicians
Intersection: rats
I enjoy reading the insightful newsletter as it appears in my email box. My background is in early human development (brain and social research) and my humour is upbeat and slightly satirical. The venn diagram I’m submitting for this contest: What do brain researchers & politicians have in common? Rats. My students do appreciate my humour, fyi and hope you do too! 🙂
A happy ThanksGiving to you in the southern climates.
-kate
Left: Evaluators
Right: Kitchen Blenders
Intersection: Process
Wat are evaluators and vampires always on the lookout for?
Left: Evaluators
Right: Vampires
Intersection: Stakeholders
Left: Spock
Right: Diagram
Intersection: Logic Model
Left: Evaluators
Right: Star Trek
Intersection: Data
Here’s my example entry!
Left: Evaluators
Right: Muppets
Intersection: The Count