I am Susan Kistler, the American Evaluation Association’s Executive Director and aea365’s regular Saturday contributor. Last week, at the Minnesota Evaluation Studies Institute, we had a discussion about when to use derived variables.
Lessons Learned – What is a derived variable? Derived variables are variables that are computed based on other variables.
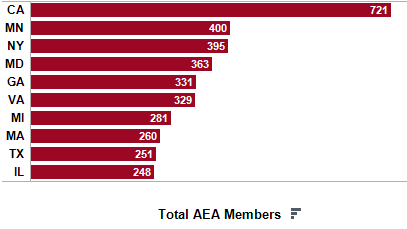
 We began by looking at the distribution of AEA members residing in the United States and quickly found that California dominated the states in terms of members residing there. But this didn’t really tell the whole story. The top ten states by total number of members residing in them is shown at right. Having over 700 members in California would be judged differently from having over 700 members in Rhode Island given each state’s population.
It was time to add population to the mix.
First, we divided the total members in the state by the state’s population. This gave us us numbers like 0.0000391204283265605 which, while accurate, were difficult to readily read and interpret. Multiplying by one million resulted in a derived variable representing the number of members per million state residents.
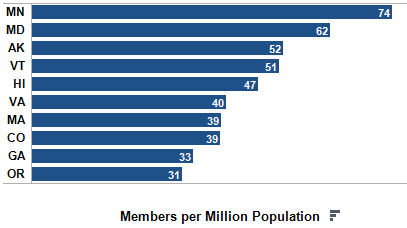
 The next graph at right is based on the derived variable, members per million population. California, once so dominant, doesn’t even make this new top ten list and states with smaller populations, such as Alaska, Vermont, and Hawaii, are now reflected more in the mix.
The derived variable in this case helps to make more direct state-to-state comparisons, taking into account population.
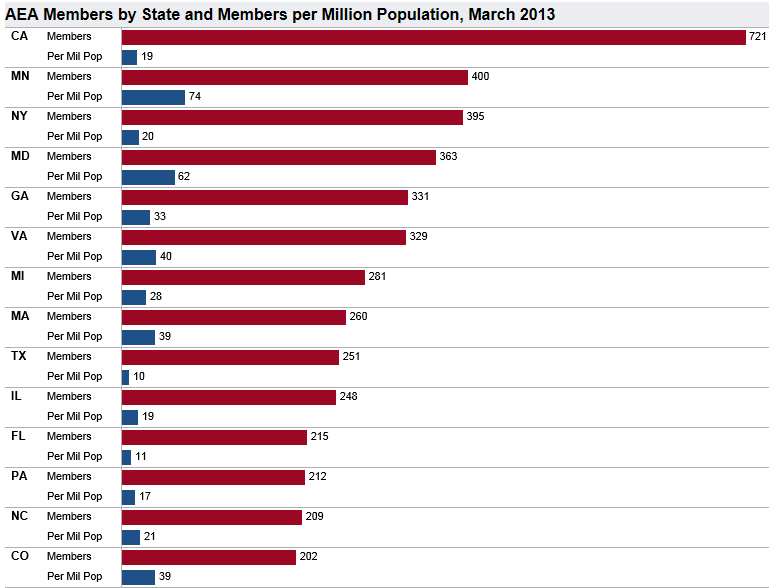
Want to check out total membership and member density in your state? Click on the graph below to go to the full interactive option showing every state.
 Do you have questions, concerns, kudos, or content to extend this aea365 contribution? Please add them in the comments section for this post on the aea365 webpage so that we may enrich our community of practice. Would you like to submit an aea365 Tip? Please send a note of interest to aea365@eval.org. aea365 is sponsored by the American Evaluation Association and provides a Tip-a-Day by and for evaluators.

Can I really be the only member of AEA in SD? That’s kind of a sad statement, despite our small population.
16 members in South Dakota!
Interesting findings, and nice visualization of the patterns. I wonder if the DC area has a higher concentration of evaluators than Minnesota? I suppose you’d need to look at zip codes and determine how many evaluators lived within, say, 30 miles of DC and 30 miles of the twin cities? I’ve always assumed that the DC metro area has the highest concentration of evaluators but I’ve never known for sure.
It does Ann! Click through to
http://public.tableausoftware.com/views/DomesticAEAMembersTotalandperMillionStatePop/Dashboard?:embed=y&:display_count=no
And scroll down. I included DC at the bottom for comparison.
This dashboard is more interactive and includes the DC addresses. DC is off the charts with 498 members per million.
I actually like the version of the chart that is online best. The one that went out in the email bothered me all night because of the different scales.
Ahhhh yes, I see now. The 498 members per million is a lot closer to the type of number I was expecting to see. Thanks for clarifying!