My name is Jeneen R. Garcia. I’ve been a full-time evaluator at the Independent Evaluation Office of the Global Environment Facility (GEF IEO) for the last seven years. The GEF is the largest multilateral funder of environmental programs worldwide. Because the programs we evaluate almost all take place in complex social-ecological systems, we constantly need to seek out new methods for dealing with complexity.
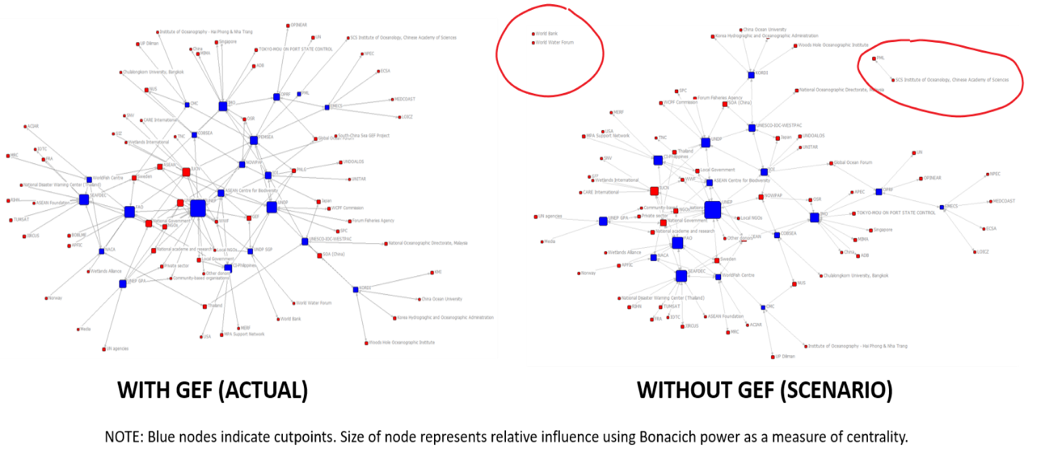
One of the methods we’ve used is Social Network Analysis (SNA). In one evaluation, we wanted to assess the role of the GEF in increasing interactions among environmental actors at the regional level. Two things made this system complex:
1) the work of these many actors intersected, but they had no hierarchical structure, and
2) interventions took place at multiple scales, which ultimately shaped interactions at the regional scale.
It’s hard to keep track of what everyone says they’re doing and who they’re doing it with. By mapping the relationships among actors, SNA allowed us to see how well-connected the actors in the region are, and which ones are key to keeping the network well-connected.
Because it was an impact evaluation, we also needed some sort of counterfactual to compare our observations with. The big problem was, it is practically impossible to “randomly select” a region that is comparable to any other, much less find a high enough number of them to ensure statistical robustness. In this case, we were looking at the South China Sea, a region with several territorial conflicts, and which GEF has funded for > 20 years. How could we find a region to compare with that?
Hot Tips
- Instead of looking outward, we created a scenario of the same region without GEF’s presence. We did this by redoing the SNA with the same set of actors except the GEF. The result was, without GEF support, some actors that were important at the country level became disconnected from the regional discussions.

- We did not rely on this analysis alone to assess the impact of GEF funding in the region. We triangulated it with field visits, interviews at multiple scales, document reviews, environmental monitoring data, global databases, and satellite images, among others. A wide range of evidence sources and methods for analysis is your best defense against data gaps in complex systems!
Rad Resources:
To find out more about which SNA measures were used to come up with our findings, you can check out this paper that I wrote up on the analysis.
You can also see how this analysis fits in with the larger impact evaluation by reading the full report.
For more on the basics on the basics of SNA and how it can be used in evaluation, you can explore this Prezi I made. It includes links to evaluations, software, and other resources related to SNA. (CAVEAT: I delivered that presentation to a Spanish-speaking audience and haven’t translated it yet. My apologies to the non-Spanish speakers!)
The American Evaluation Association is celebrating Social Network Analysis TIG Week with our colleagues in the Social Network Analysis Topical Interest Group. The contributions all this week to aea365 come from our SNA TIG members. Do you have questions, concerns, kudos, or content to extend this aea365 contribution? Please add them in the comments section for this post on the aea365 webpage so that we may enrich our community of practice. Would you like to submit an aea365 Tip? Please send a note of interest to aea365@eval.org. aea365 is sponsored by the American Evaluation Association and provides a Tip-a-Day by and for evaluators.
