Greetings! I am Simon Geletta – Program Co-Chair for the SNA-TIG and associate professor of public health atDes Moines University in Iowa. In this post, I illustrate how I used the open-source softwareGephi to conduct a social network analysis of hospital visitation patterns in Iowa.
Hospital utilization patterns are important to healthcare services research because they relate to the concept of access. Using SNA revealed more insight than other more “traditional” analytic approaches such as statistical summary tables and GIS maps, which provide insight on abstract (the statistical approach), or spatial patterns (the GIS approach). SNA allowed me to look at patterns of hospital use in the network, which shed further light on patient access to healthcare services.
Lesson Learned: Getting Data into Gephi. Originally, my data were stored in an Excel spreadsheet. To import the data, I used Gephi’s “Data Laboratory” interface (shown below). In my analysis, I used hospital locations and patient locations as nodes. The edges linked the patient location nodes to the hospital location nodes.
Hot Tip: You can import data into Gephi from a range of standard data formats, including spreadsheets and delimited files (comma separated, tab delimited, etc).
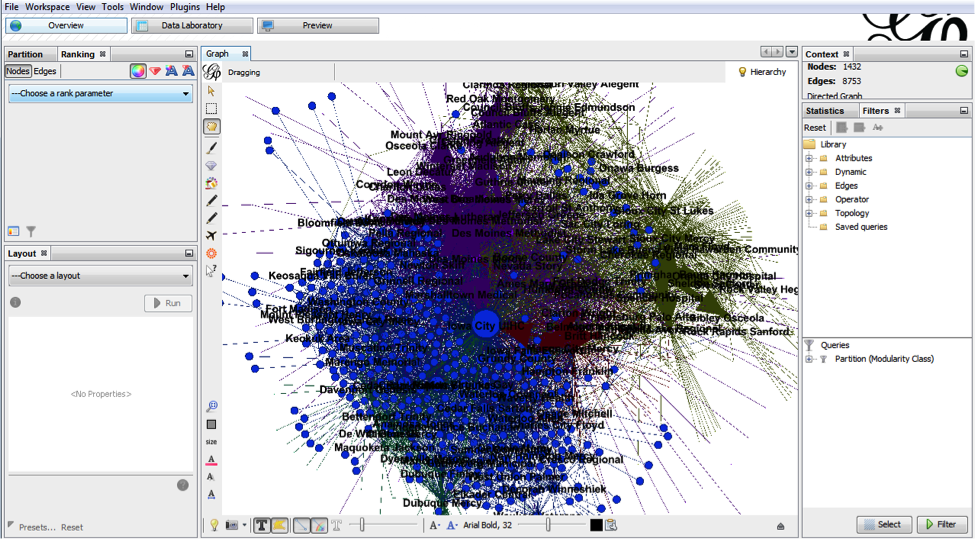
Lesson Learned: Visualizing Data in Gephi. In Gephi, I used the “Overview” window to visualize and analyze my data. To get an intuitive view of the hospital visitation network, I selected theForce Atlas 2 layout option, which balances speed and precision.
Hot Tip: Gephi includes 12 layout settings – fit for a wide array of network sizes and complexity. After applying layout settings, you can also tweak your layout to make it less cluttered.
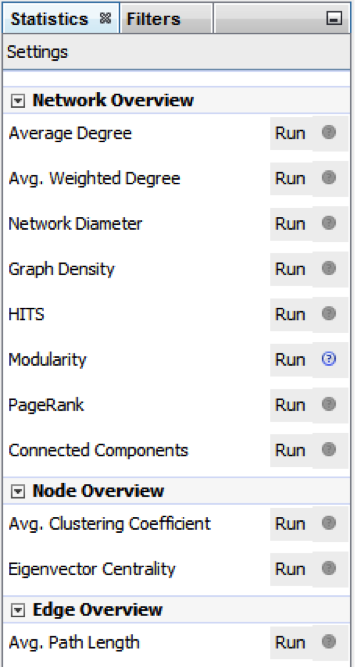
Lesson Learned: Analyzing Data in Gephi. I used the modularity analysis function to identify communities within the network. The analysis revealed five closely knit hospital visitation patterns or communities that reflected geographic characteristics (i.e., most visits were to hospitals closest to the visitors), and organizational characteristics (larger hospitals attracted more patients – not only from their immediate locality but also patients that were further away from their localities.)
Once the communities were delineated, the “Overview” window also allowed me to filter the network by the community partitions and evaluate each community as a separate network. You can export and use measures from Gephi for modeling and hypothesis testing using other statistical software.
Rad Resource: For more information on the modularity analysis function, check out this article byV. D. Blondale and colleagues.
Lesson Learned: Selecting an appropriate layout for your network is an iterative process. It is not an “exact” science but a combination of science, art, and aesthetics.
The American Evaluation Association is celebrating Social Network Analysis Week with our colleagues in the Social Network Analysis Topical Interest Group. The contributions all this week to aea365 come from our SNA TIG members. Do you have questions, concerns, kudos, or content to extend this aea365 contribution? Please add them in the comments section for this post on the aea365 webpage so that we may enrich our community of practice. Would you like to submit an aea365 Tip? Please send a note of interest to aea365@eval.org. aea365 is sponsored by the American Evaluation Association and provides a Tip-a-Day by and for evaluators.


“edge” is the name given to the link or connection between entities. In a network diagram edges are represented as lines while entities (or more appropriately “nodes”) are represented by vertices. There are a number of online locations where you can find these definitions… the easiest to find being Wikipedia (for example this link: http://en.wikipedia.org/wiki/Graph_theory)
A question from an SNA novice:
Could someone please define “edge” as it replies to SNA? If there is a glossary of SNA terms that others have found useful, I would appreciate the knowledge.
Thanks!