
I’m David Keyes, founder of R for the Rest of Us. Over the last five years, I’ve helped thousands of people use R, the tool for data analysis and visualization.
As someone who came from evaluation before focusing on teaching R, I’ve seen how it can improve the work of evaluators, especially when it comes to reporting. But many people believe that R is only worth using if you are doing complex statistical analysis. This is definitely not the case. Much of R’s power comes from its potential to improve the efficiency of your data analysis and reporting. Let me share a few ways that I’ve used R to help organizations report more efficiently than they could without it.
You may not know it, but many people who make high-quality data visualization use R. Journalists at the New York Times, the BBC, and other high-profile outlets use it.
One of the reasons these people use R for data visualization is that there are techniques to make plots that follow your organization’s branding guidelines. In my work with the Ford Family Foundation, I have helped produce all of the visuals for the annual Oregon by the Numbers report. The code I have written enables me to make all of the plots use TFFF fonts and colors.
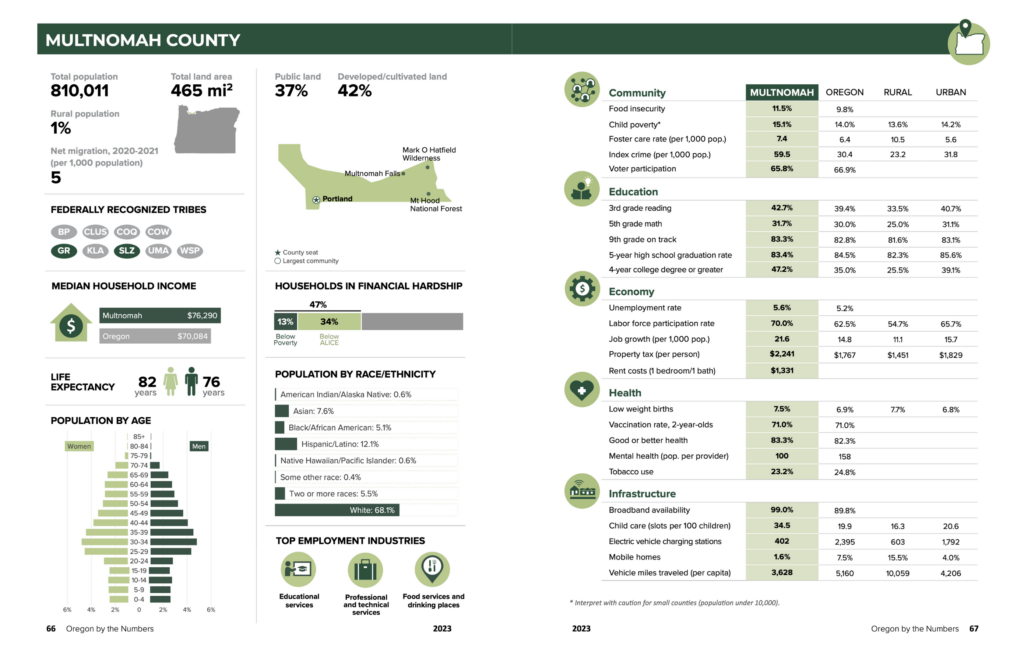
Generating the charts and maps that go into Oregon by the Numbers could be a heavy lift. With over 250 plots to make each year, the thought of doing this in a point-and-click tool like Excel makes me shudder. But with R, I can write code to automate the process of generating these plots.
R can also be used to make entire reports. Using tools such as R Markdown or Quarto, you can combine code for data analysis and visualization alongside text. This process, known as reproducible reporting, enables you to generate up-to-date reports at any point with minimal effort. Evaluators use this technique to provide immediate feedback to clients.
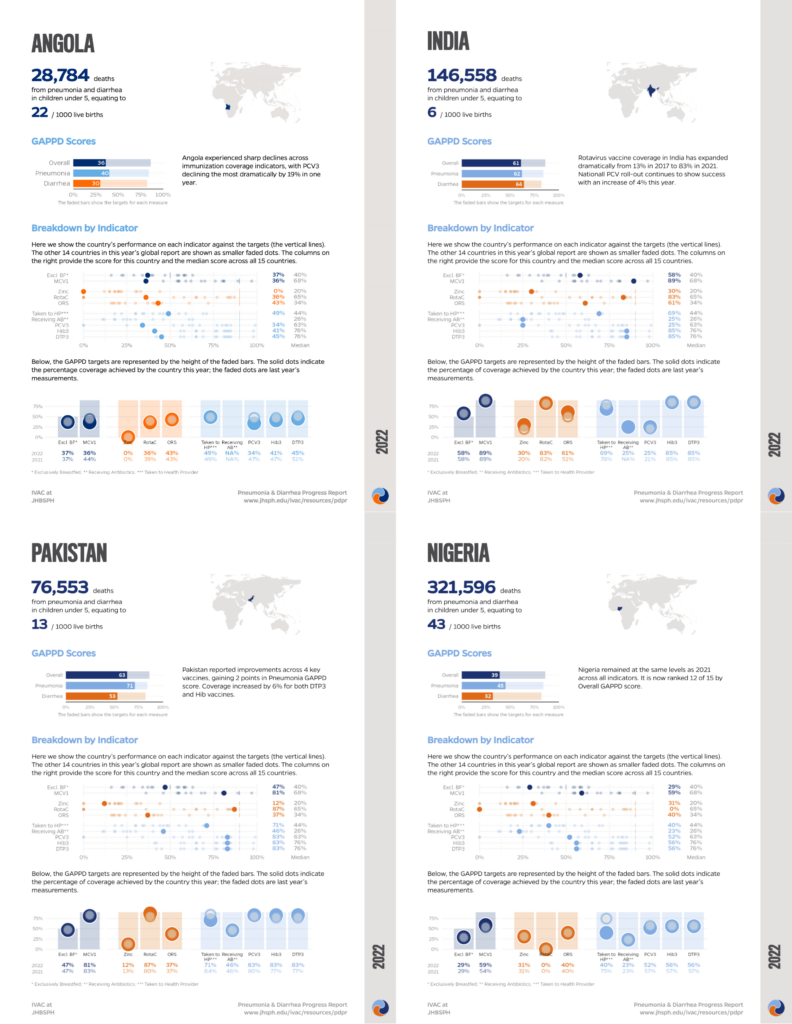
This is just the start of what you can do when using R for reporting. An additional technique of particular interest to evaluators is known as parameterized reporting. With parameterized reporting, you can create one R Markdown or Quarto template document and then use it to generate multiple reports. Working with the International Vaccine Access Center at Johns Hopkins, we recently used parameterized to help produce pneumonia and diarrhea progress reports for countries around the world.
No matter what type of evaluation you do, reporting is sure to be a part of your workflow. And no matter what your reporting looks like, I’m sure that R can help you to make it more efficient.
Rad Resources
My book, R for the Rest of Us: A Statistics-Free Introduction, has a free online version and covers the topics discussed above.
If you want to learn to use R for high-quality data visualization, check out Data Visualization: A practical introduction by Kieran Healy and ggplot2: Elegant Graphics for Data Analysis by Hadley Wickham, Danielle Navarro, and Thomas Lin Pedersen.
If you want to learn about reproducible reporting, including parameterized reporting, check out R Markdown: The Definitive Guide by Yihui Xie, J. J. Allaire, and Garrett Grolemund. To learn about Quarto, Check out Chapter 28 of R for Data Science by Hadley Wickham, Mine Çetinkaya-Rundel, and Garrett Grolemund.
We’re looking forward to the fall and the Evaluation 2024 conference with our colleagues in the Local Arrangements Working Group (LAWG). Do you have questions, concerns, kudos, or content to extend this AEA365 contribution? Please add them in the comments section for this post on the AEA365 webpage so that we may enrich our community of practice. Would you like to contribute to AEA365? Review the contribution guidelines and send your draft post to AEA365@eval.org. The views and opinions expressed on the AEA365 blog are solely those of the original authors and other contributors. These views and opinions do not necessarily represent those of the American Evaluation Association, and/or any/all contributors to this site.