Greetings evaluation enthusiasts! We are Katherine Haugh, Smriti Bajracharya and Kat Athanasiades from Innovation Network.
We have found timelines to be an incredibly useful tool, and believe they are underutilized in the evaluation world. We’d like to change that! For the past few years, we have incorporated timelines into our data analysis process, integrated visual timelines into text-heavy reports, and used them as facilitative tools to increase stakeholder engagement.
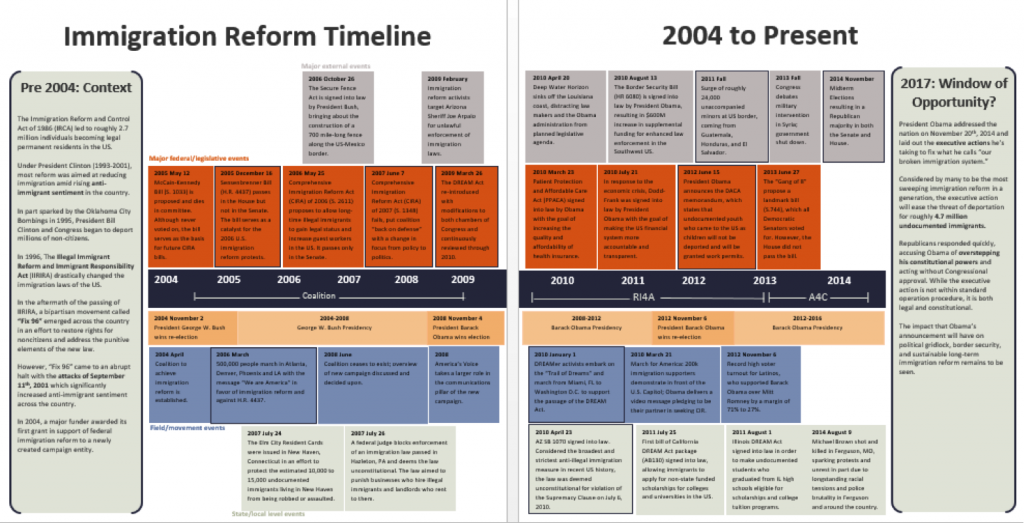
Hot Tip: Timelines can be used for data analysis. Visual timelines allow evaluators to see correlations between different events and more easily identify patterns, themes, and trends. This is a rough draft of a timeline that we created for a client, mapping ten years of immigration reform grantmaking. Various contextual elements impacting immigration reform—presidents, major legislative events, and many others—are organized in a visually appealing and clear way. Visual timelines allow evaluators to “zoom out” from a single event so that they can better understand the context in which that event occurred.
Major legislative events
Presidential election cycles:
External events:
Rad Resource: The above timeline benefitted from a great deal of formatting and data viz expertise! In Make Your Data Count, we outline the five elements of visual reporting and cover tips for formatting and refining visual report elements—like timelines—in this handout.
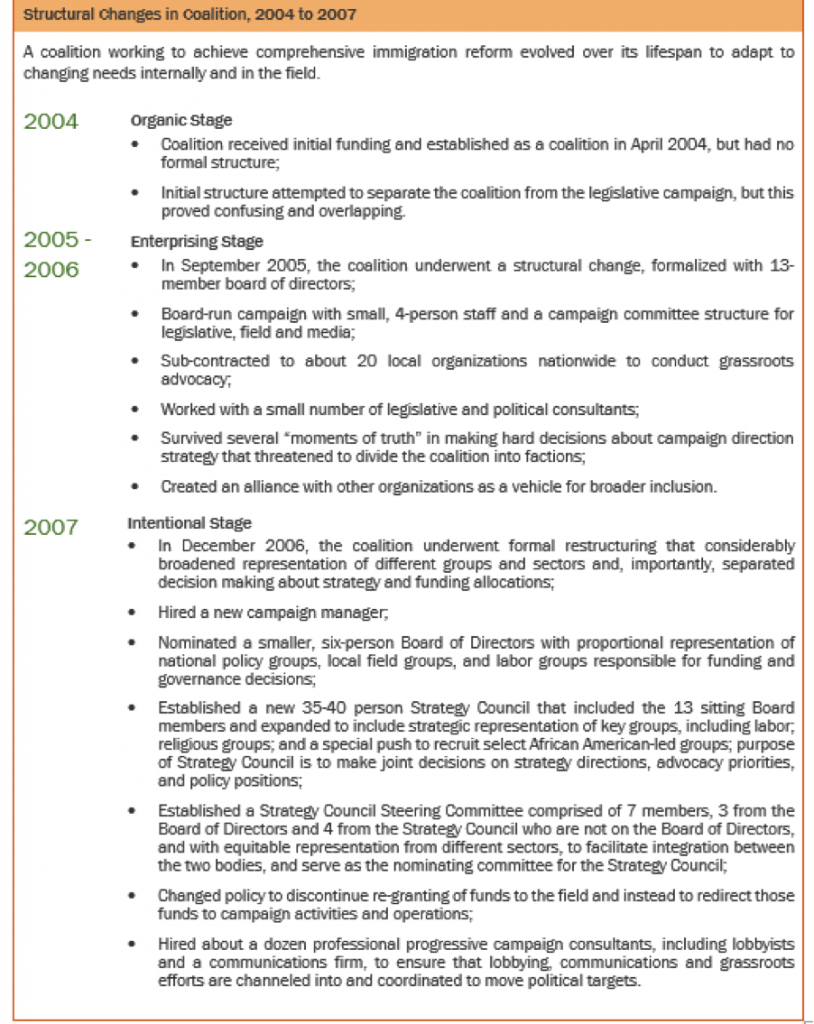
Hot Tip: Timelines are an incredibly useful visual addition to a text-heavy report. We created a timeline that looks similar to the one below to complement the aforementioned immigration reform report. This timeline helped us better understand the structural changes that the immigration reform coalition underwent between 2004 and 2007. This timeline also allowed us (and our audience) to visualize and comprehend how and why the coalition evolved over time. Timelines are especially useful for advocacy evaluations in which different players, goals, and resources are constantly shifting.
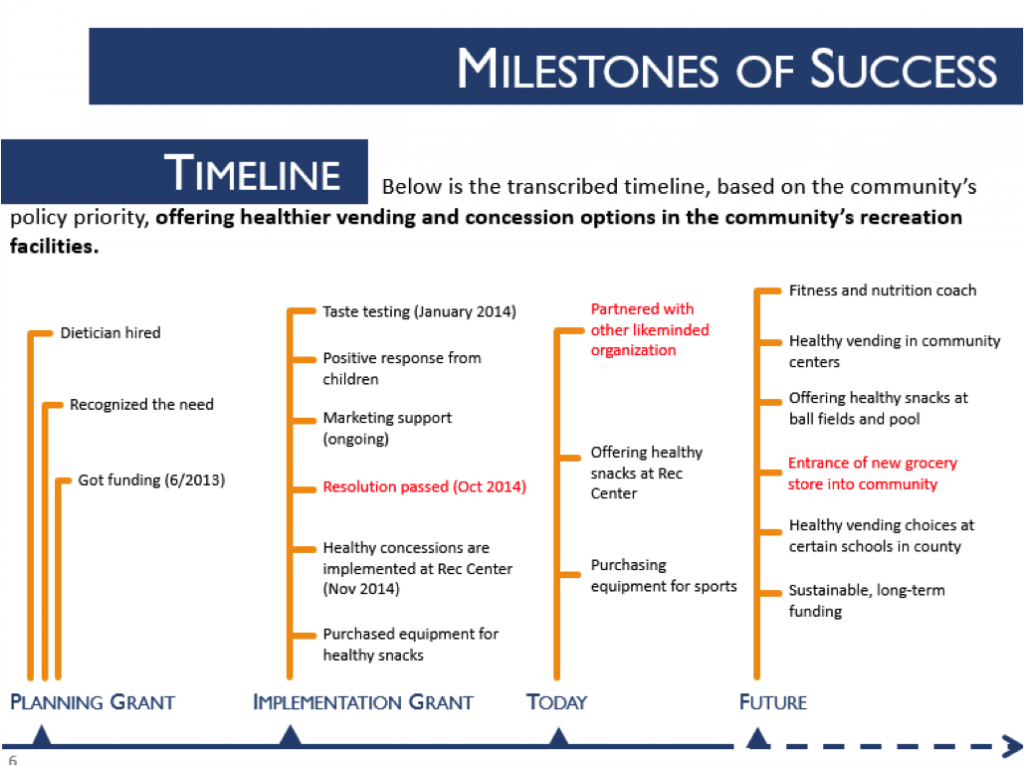
Hot Tip: Timelines can be used as a tool for increasing stakeholder engagement. For example, in a health advocacy project, community members timelined (yes, a verb!) past successes and challenges in an effort to understand their forward progress around improving health policies. These timelines allowed community members to visualize their work and strategies as a group, helping them interpret their experiences and creating a shared understanding of their anticipated long road to success.
This timeline’s time periods are shown across the bottom. Red text indicates particularly important events in the time periods.
Rad Resource: We presented at AEA2015 in Chicago on “Putting Data in Context: Timelining for Evaluators.” For more tips and tools for creating visual timelines, check out our slides and this handout from the presentation.
Do you have questions, concerns, kudos, or content to extend this aea365 contribution? Please add them in the comments section for this post on the aea365 webpage so that we may enrich our community of practice. Would you like to submit an aea365 Tip? Please send a note of interest to aea365@eval.org . aea365 is sponsored by the American Evaluation Association and provides a Tip-a-Day by and for evaluators.


Hi,
We have used timelining (actually call it developing a project and/or evaluation chronology) a great deal, especially when working with community initiatives and the non-profit sector. Some years ago, we described another use of chronological thinking in evaluation, that we call ‘key moments ananlysis’,used in the participatory evaluation of a multi-partner community initiatve for women’s health in Ottawa, Ontario. See: Estable, Meyer, Torres & MacLean (2006), Challenges of Participatory Evaluation Within A Community-Based Health Promotion Partnership: Mujer Sana, Comunidad Sana – Healthy Women, Health Communities. Canadian Journal of Program Evaluation, 21(2) pp 25-57. Perhaps someone would find this useful.
There’s also a software designed to creatively visualize timelines that someone told me about, http://www.tiki-toki.com. Their examples are beautiful but I haven’t had time to learn and use myself so I can’t comment on this.
I’ve never heard of Tiki Toki, but it looks really cool! It would be wonderful to bring our visual timelines to life. I’ll definitely check it out. Thank you Kylie!