Hi, I’m Heather Krause a mathematical statistician, data scientist and founder of Datassist. After many years collecting data, conducting analysis, and designing data communication material across the globe it became really clear to me that data is never neutral. And that much of what we consider to be an objective science with “best practices” is often simply one world view among many. This is true even in something that appear genuinely value-free like math.
Lessons Learned: Math is math, right? Two is always two. Except when it’s not.
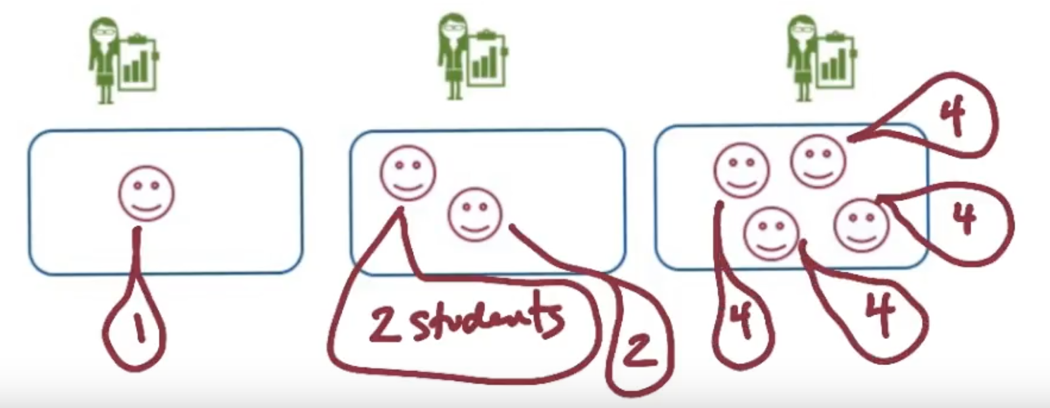
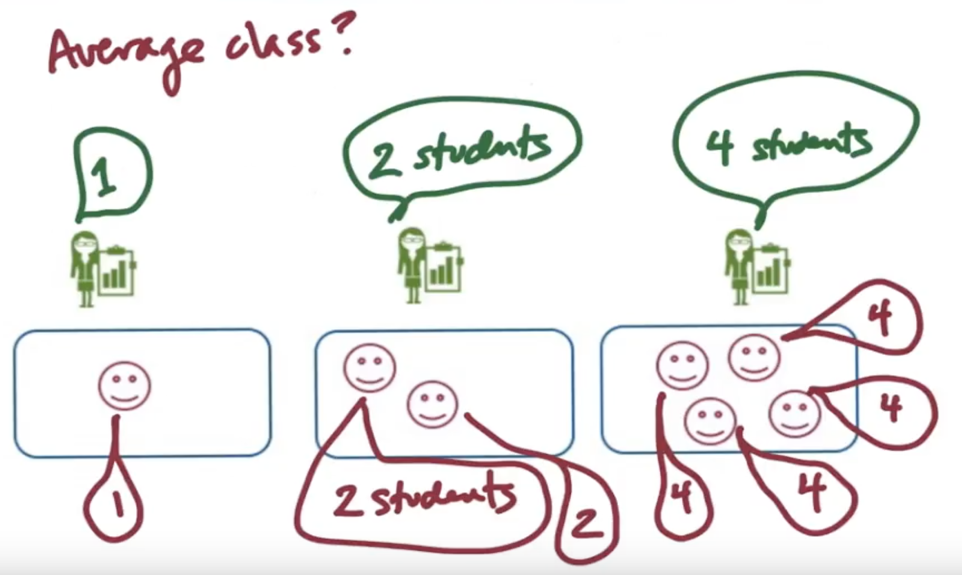
Let’s say we’re doing some research in the education sector and we want to talk about how average class size affects outcomes. We study three classes. Take a look at the image below and calculate the average class size.
The average class size at this school depends entirely on who you ask.
Even though there is nothing challenging or complex about the math involved in this question, we still can’t count on objective data analysis. Why? Because the “correct” answer depends on your worldview. Let’s look more closely.
If we ask the students how many students are in a class, we get the following answers:
Now let’s ask the professors how many students are in a class.
The first professor reports one student. The second professor says there are two students in a class, and the Class Three professor says there are four students per class.
The average class size depends entirely on whose point of view you’re taking. That is, where you put the locus of power (or centre of power) in your analysis — on the professors or on the students.
How often do we automatically put the centre of power in a specific place and simply assume that it’s correct. (Not that it’s necessarily incorrect — but it’s not the only option.)
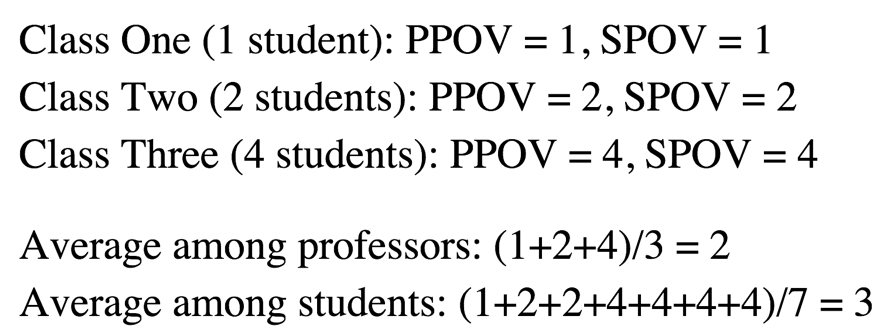
Let’s look at the math.
Both answers are technically correct. The math is sound. But how does that work? The answer to the question “what’s the average class size?” depends on whether you’re a teacher or a student. And that’s why objective data analysis isn’t really a thing — because there will always be assumptions you need to make, and making assumptions removes objectivity.
Hot Tip: Every time you do an analysis or a calculation with your data, take five minutes and ask yourself:
- Where have I put the center of power in this calculation?
- Whose perspective could change this calculation?
- Can I come up with an entirely different yet also correct answer?
The American Evaluation Association is celebrating Feminist Issues in Evaluation (FIE) TIG Week with our colleagues in the FIE Topical Interest Group. The contributions all this week to aea365 come from our FIE TIG members. Do you have questions, concerns, kudos, or content to extend this aea365 contribution? Please add them in the comments section for this post on the aea365 webpage so that we may enrich our community of practice. Would you like to submit an aea365 Tip? Please send a note of interest to aea365@eval.org. aea365 is sponsored by the American Evaluation Association and provides a Tip-a-Day by and for evaluators.


Hi Heather,
I thought your post was great and highlighted a source of bias that isn’t always as obvious to people as we might think. As a math teacher I can tell you that one misconception that students have is that there is always a “right answer” when they are doing math; that is until we get to statistics. Teaching students the analytical skills required to be proficient in statistics is unlike teaching any other math as there is not always a sure-fire algorithm, method or formula you can use to actually solve a problem. It requires more analysis and intuition than other topics in math. Having students overcome the misconception that there is one answer that is always correct in math is a major steppingstone for students to overcome in high school. Furthermore, I can see how it could also be a surprise to someone who is just getting into program evaluation with a less mathematical background.
Overall, I thought the example you gave was great. The math involved is easy to understand which makes your example accessible to all who read it. I think you have also done a good job of highlighting the importance of being critical of data and how it was collected in order to consider and avoid any bias that may be present. In class I often talk about how people can skew statistics and use them to tell the story they want to portray. I really like your hot tip at the end and think it is an important set of questions for program evaluators to be aware of when carrying out tasks that involve both qualitative and quantitative data. In addition to this I can see how I can adapt this set of questions for use in my math classroom to make my students more aware and critical when they are dealing with statistics.
Thank you for sharing this example and if you have any other hot tips about data analysis please share them.
Regards,
-Danny Brown
LOVE IT! Thank you for sharing. I understand Natasha’s point about the straight-up math, very true. (Sends us wading into the pros/cons of the average being reported as a partial person, which can be impractical in certain contexts.) I agree that focusing solely on “true” answers can cause us to miss “actual” answers, which is related to the locus of power (and the power of locus!). This is why I love mixed methods and the dual process of synthesis and disconfirming. Let’s report all 3 answers and then talk about the interesting story behind why they’re not the same, and the implications that has for the effectiveness of what we’re evaluating.
Thank you for your post, Heather. I wholeheartedly agree that we have to account for perspective and biases in our work. I am a little confused by the example used here. Can we clarify that that average number of people in a classroom is not what is being calculated? It appears, instead, that what is being calculated is the average response of two different groups of people. The unit of analysis is students’ and teachers’ responses, not an actual count of students in classrooms. The point you make is well taken, but the illustration does not seem to fit. Where we get our data matters and how we do the math matters, but the average class size does not depend on who you ask because it is not a matter of opinion. There is one answer to that question (7/3). If I am missing something, I would appreciate some clarification because, again, I agree with your central argument. Or perhaps there is another example to illustrate the point?
“The average class size at this school depends entirely on who you ask.” Wait, what? No, the average class size is 2.33.
However, your estimate of the average class size does depend on the methods you employ to calculate it. But there is still an objective truth to average class size.
Both answers are not technically correct. Unless the question is “What is students’ perception of their average class size?” Which is not the same as the question “What is the average class size?”
Heather,
I love having concrete examples to explain this concept. Thank you!
Sincerely,
Adrienne
Heather, what a great example of how whose voice is heard affects evaluation findings! I’ve shared it with my networks and will continue to reference it as I promote local ownership in evaluation.
Best wishes,
Carlisle
Heather,
This is brilliant and cuts through a dilemma I have been struggling with to make precisely the point your are making about the locus of power. I will quote you in a book I am finishing this month on Outcome Harvesting.
Many, many thanks,
Ricardo