Hi there, I’m Heather Krause from Datassist. I’ve been working with women and data internationally for over a decade. I’m delighted to have the opportunity to add my voice and share a bit about the importance of including quantitative data — in addition to qualitative data — in research to incorporate a feminist perspective.
Using quantitative data in nuanced and complex ways can help us better identify and understand trends in the lived experiences of women, as well as key causes of those patterns.
Lesson Learned: Complex Models = Clear Communication
Conducting evaluation from a feminist perspective calls for both conceptual understanding of feminist principles and advanced understanding of statistical methods.
While adding complexity to gain clarity may sound counterintuitive, in reality, complex statistical analysis is much better for evaluation from a feminist perspective than simple data tables. Simple tables often hide or oversimplify complex trends occurring in the real world, where a more nuanced approach can highlight gender- and other socially-based trends.
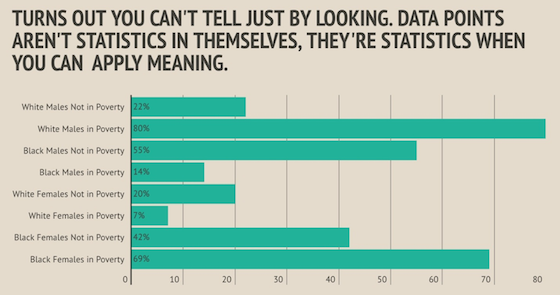
In How Not to Visualize Like a Racist, I examined the importance of a complex multivariate model in graphs that show all dimensions, rather than focusing on only one or two. Where simple tables may appear to make the data more accessible, they hide the real trends, whereas more nuanced analysis highlights and clarifies true patterns.

By building this statistical model that addresses the interactions between gender and other social factors, we uncover the truth.
Lesson Learned: Changing the Model Can Change the Perspective
In a world where so much data historically overlooks the feminist perspective, how can we make changes? In some cases, simple steps like changing a variable — i.e., using female respondents as your baseline, rather than male — can have an immediate and obvious effect on analysis.
Similarly, the use of moderating variables in your models provides insight into how different aspects of respondents’ social identities interact to inform their experiences. This is known as intersectionality. It is important to consider gender when analyzing data, of course; but it is equally important to understand how the interplay between gender and race, class, ability or ethnicity can affect your data.
Rad Resources:
Last October, the United Nations and Statistic Finland hosted the 6th Global Forum on Gender Statistics with the goal of bringing together policymakers and researchers to identify gender gaps and new ways of measuring and collecting data that represents both men and women equally — and ultimately, to measure global progress towards gender equality.
They made many of the presentations from that event available to the public online, providing insights from global leaders on international initiatives on gender statistics.
For more details on quantitative feminist research, I recommend Feminist Measures in Survey Research by Catherine E. Harnois.
The American Evaluation Association is celebrating Feminist Issues in Evaluation (FIE) TIG Week with our colleagues in the FIE Topical Interest Group. The contributions all this week to aea365 come from our FIE TIG members. Do you have questions, concerns, kudos, or content to extend this aea365 contribution? Please add them in the comments section for this post on the aea365 webpage so that we may enrich our community of practice. Would you like to submit an aea365 Tip? Please send a note of interest to aea365@eval.org. aea365 is sponsored by the American Evaluation Association and provides a Tip-a-Day by and for evaluators.
