Hello AEA colleagues – Katherine Haugh and Jenny Nulty (Lyons) here. Back in November 2019, we led a session at AEA about using journey mapping as an evaluation tool. We were thrilled to see so much enthusiasm and curiosity about the topic, so below we’ve shared more information and tips for using journey mapping as a fun and innovative evaluation tool.

So, first things, first: what is journey mapping?
Journey mapping is the process of visualizing the journey that a person or a group goes through to achieve a goal. It has its origins in the field of human-centered design and is based on the principle that in order to really understand someone’s holistic experience, you must account for the rational, emotional, and sensory layers of their experience.
Journey maps can:
- Show pain points and areas of strength
- Help staff who only work on one piece of a project understand the whole journey
- Build empathy and understanding for the person receiving the service
Hop Tip: Conduct a mood analysis. To capture the emotional layer of your group’s journey, try a simple exercise with your team: at the start of your weekly meeting, ask everyone for one word of how they are feeling. Then, take a pause, analyze the words, and share them back with the team for group reflection.
Lesson Learned: Using journey mapping as part of an evaluation. In the evaluation context, journey mapping can be used to explore multiple realities simultaneously, and help groups understand the multi-layered and evolving story of their impact. Journey mapping combines storytelling, visualization, and facilitation. One of the coolest things about journey mapping is that it can be used as a form of data collection, reflection, and reporting tool.
Hot Tip: Check out the literature on data-driven retrospective interviewing to explore how this technique can strengthen your journey mapping approach.
Lesson Learned: Journey mapping with USAID LEARN. Kat’s team at USAID LEARN used journey mapping to tell the story of their 5-year contract from multiple viewpoints; they used the metaphor of an iceberg to illustrate that what is often seen (trainings held, events planned, etc.) is only part of the story and much learning and adapting occurs below the surface.
Hot Tip:

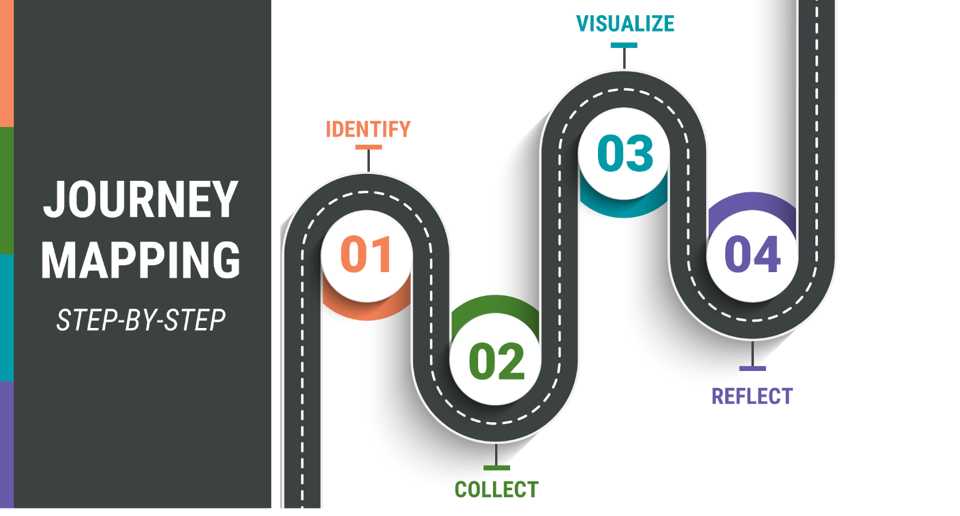
Across both of these applications, we’ve identified four general steps:
- Identify the starting point and ending point of the journey map
- Collect data on the journey through individual interviews and/or small group workshop facilitation
- Visualize the collective journey through live graphic recording or by combining multiple data sources into an interactive diagram
- Reflect collectively about the journey map process and key takeaways
Rad Resource:
Given that this is a new area, we are hoping to fill this gap with our own rad resource! We are actively collecting stories of journey mapping in action. Please get in touch with us; contact Kat at kat.haugh@gmail.com and Jenny at jenny@pivotdatadesign.com. We’d love to hear from you!
The American Evaluation Association is celebrating Data Visualization and Reporting (DVR) Week with our colleagues in the DVR Topical Interest Group. The contributions all this week to aea365 come from DVR TIG members. Do you have questions, concerns, kudos, or content to extend this aea365 contribution? Please add them in the comments section for this post on the aea365 webpage so that we may enrich our community of practice. Would you like to submit an aea365 Tip? Please send a note of interest to aea365@eval.org. aea365 is sponsored by the American Evaluation Association and provides a Tip-a-Day by and for evaluators.

Hi!
What a great idea to have such a visual evaluation tool.
I was just wondering how such a tool would be used for outcome evaluations of a social program. Would it be used by an evaluator primarily to identify scheduled points of data collection (and how) on the journey towards program completion? Or would it be a more individualized self-reflective tool for participants of a social program (perhaps including set activities and reflections on changing mindsets and emotions), developed by an evaluator and shared at the start of a program, with specified monitoring/data collection interventions throughout? Or would it be something else?
Also, do you know if any other resources exist, beyond the one you are currently compiling?
Thanks.
Hi there
Warm greetings
Very interesting as an approach. I’m leasing in Senegal, west africa ans I’d like to know how to be part or benefit a training on this approach.
Thank you