Hello, AEA365 community! Liz DiLuzio here, Lead Curator of the blog. This week is Individuals Week, which means we take a break from our themed weeks and spotlight the Hot Tips, Cool Tricks, Rad Resources and Lessons Learned from any evaluator interested in sharing. Would you like to contribute to future individuals weeks? Email me at AEA365@eval.org with an idea or a draft and we will make it happen.
Hello! We are Ava Elliott, Sylvia Kwon, and Corey Newhouse. We work at Public Profit, an independent evaluation consultancy that works with nonprofits, foundations, schools, and governments to help them use data more effectively.
When our team at Public Profit initially looked for resources to build our participatory evaluation skills and knowledge, we found that many guides for evaluation have terrific advice for how to plan an evaluation and gather data but fall silent when it comes to meaning making. That’s understandable: most evaluators have been trained to sit alone with a stack of data tables until something useful pops out of their brain. Others have been trained to describe every single thing in a graph or table, and trust that the meaning of the data will emerge for readers. Neither is particularly effective.
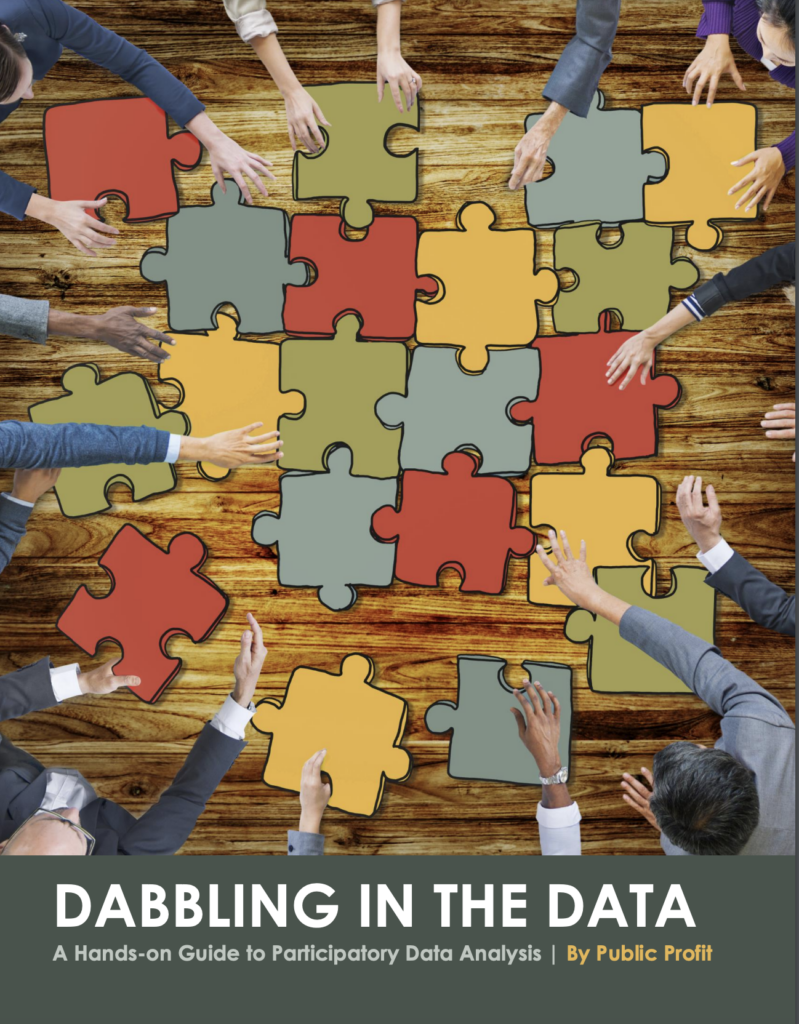
Public Profit wrote Dabbling in the Data: A Hands-On Guide to Participatory Data Analysis to give evaluators, and the folks they work with, a jumpstart in interpreting data collaboratively. Involving teams in making meaning of data has multiple benefits:
- Rigor – All data is subject to interpretation. Evaluators improve rigor by engaging multiple interest holders in interpreting information, bringing to light more varied and nuanced perspectives that deepens the analysis.
- Meaning – When teams make meaning of data together, they are better able to understand the reasoning behind the analysis, more likely to perceive the findings as meaningful to their setting, and further motivated to work towards improvement and change to increase their impact.
- Engagement – Evaluation is often done to organizations and teams, rather than done with them. When people co-create the meaning of data, they exercise influence over the data and learning culture in their organization. Through this process, there is less anxiety and fear about data and greater understanding about how data can improve practices and better share their story.
Each of the 25+ hands-on activities includes the types of situations the method is best suited for, step-by-step instructions for facilitators, and suggested adaptations. We include links to related resources for those who want to learn even more.
Rad Resource

Our updated and expanded Dabbling in the Data guide is available free! After sharing the guide and implementing many of the activities with a wide range of participants and audiences, we’ve incorporated the feedback we’ve received into the better-than-ever revamped guide.
Cool Trick
Layer multiple data interpretation activities into a sequence for a team. Check out our customizable playlists on getting comfortable with data, conducting a needs and assets assessment, and more!
Webinar this Spring
We’re offering a free orientation to the Dabbling guide for AEA members this spring! Click here to sign up for notifications. (We won’t use your contact information for any other purpose.)
Do you have questions, concerns, kudos, or content to extend this aea365 contribution? Please add them in the comments section for this post on the aea365 webpage so that we may enrich our community of practice. Would you like to submit an aea365 Tip? Please send a note of interest to aea365@eval.org . aea365 is sponsored by the American Evaluation Association and provides a Tip-a-Day by and for evaluators. The views and opinions expressed on the AEA365 blog are solely those of the original authors and other contributors. These views and opinions do not necessarily represent those of the American Evaluation Association, and/or any/all contributors to this site.
