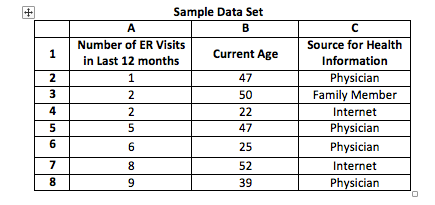
Hi! I’m Laura Sefton, Project Analyst in the University of Massachusetts Medical School’s Center for Health Policy and Research. Many AEA365 readers use sophisticated statistical software like SPSS, SAS, or Stata for their data analytic needs, but others don’t have ready access to such software and depend on more freely available options like Microsoft Excel. Excel is built to do many computational functions, but it can take time to research its help pages to get it to do what you want. I found a few functions helpful for summarizing both numeric and text-based data that my colleagues and I collected during a recent set of over 30 interviews with Medicaid members. Using the sample data below, I’d like to share what I’ve learned with you.
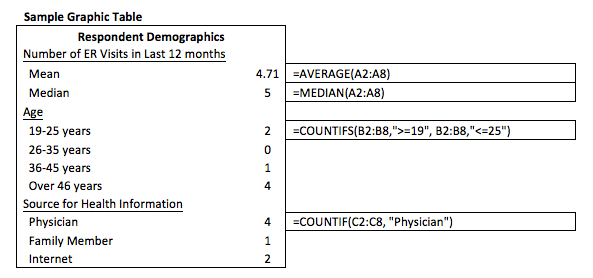
Computing means, modes, and medians: To calculate the mean of the number of ER (Emergency Room) visits, the formula instructs Excel to ‘average’ data in a range of cells. Using the sample data above, the formula below computes a value of 4.71 for the data in column A. To compute the median or mode, substitute ‘median’ or ‘mode’ for ‘average’.
=AVERAGE(A2:A8)
Counting text data: Excel can also count up the frequency of text responses. The formula is structured much like computing a mean, with the instruction to ‘count if’ certain criteria are met in a set of cells. The formula below asks Excel to count how many times the word ‘Physician’ appears in rows 2 through 8 in column C. Note the use of double quotes around the criteria. You will have to create a calculation for each separate criteria, but you can easily copy/paste and update the formula.
=COUNTIF(C2:C8, “Physician”)
Counting data grouped in ranges: We often report data in ranges and Excel can easily do this using the ‘countif’ function. Your formula needs to account for 2 criteria: the minimum and maximum numbers in the range. Note that you’ll need to add an ‘S’ to the ‘countif’ command since there are since 2 ranges are being compared.
=COUNTIFS(B2:B8,”>=19″,B2:B8,”<=25″)
Hot Tip: Create, format, and populate your summary data display in Excel. The formulas will work behind the scenes to make updates if you make any changes to your source data.
Hot Tip: Right click on status bar at the bottom of your Excel page and select calculations that you’d like to see on the bar. Excel will automatically compute and display the average, minimum, maximum, count and sum, among other options, for a set of highlighted cells.
Rad Resource: Beyond searching the Web using keywords, a good resource is Microsoft Office Support, which provides an Excel Help page, a descriptive list of Excel’s statistical functions and some tutorials.
Do you have questions, concerns, kudos, or content to extend this aea365 contribution? Please add them in the comments section for this post on the aea365 webpage so that we may enrich our community of practice. Would you like to submit an aea365 Tip? Please send a note of interest to aea365@eval.org . aea365 is sponsored by the American Evaluation Association and provides a Tip-a-Day by and for evaluators.


I found this to be very helpful. Thank you!