My name is Chris Lysy, I am a Research Analyst at Westat, the creator of Eval Central, and cartoonist at freshspectrum. You can also find me on twitter (@clysy).
At first cartooning was just a hobby, but over time I’ve started to discover the utility of a well designed cartoon. The right cartoons can be potent tools for introducing complex concepts, engaging audiences, and sparking discussion.
On my blog I’ve been experimenting with the fine line between chart junk and good illustration design. A topic briefly addressed by Edward Tufte on his website. Here are some tips I came up with to help you avoid crossing the line.
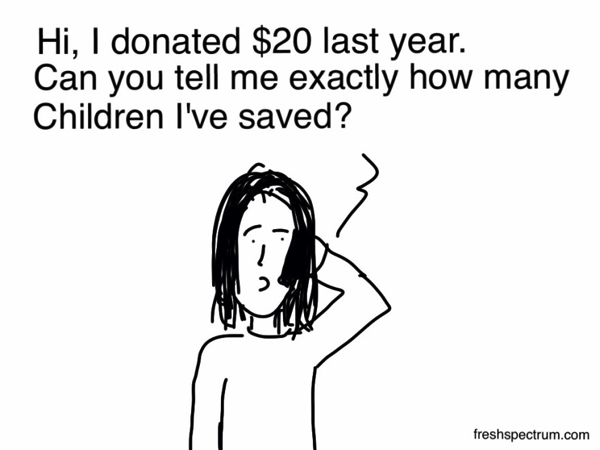
Hot Tip: 95% Concept, 5% Illustration. If you have a great concept, the illustration doesn’t have to be that great. I spend the vast majority of my time on the concept. Check out the following cartoon from my attribution post. Not the best illustration, but the point is made.
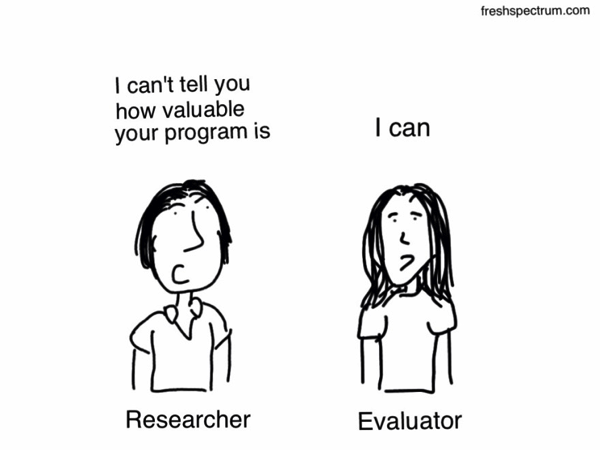
Hot Tip: Be Abrupt. Subtlety thrives in other forms of communication. You have a few seconds to capture attention, just say what you want to say. Here’s an example from my What is Evaluation? post.
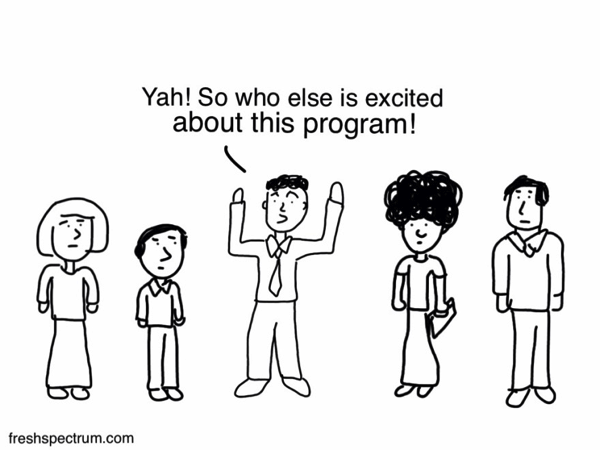
Hot Tip: Costello your Abbott. Visuals should always complement the point, not simply repeat the point. In the famous sketch, Costello didn’t completely parrot Abbott, and your visuals should not completely parrot your points. Here is an example from my counterfactual series. My cartoon complements David Henderson’s point. They work together.
“Outliers do not make for compelling client testimonials. Use your metrics to identify what the average experience in your program looks like, and get testimonials from people who fit this profile.”
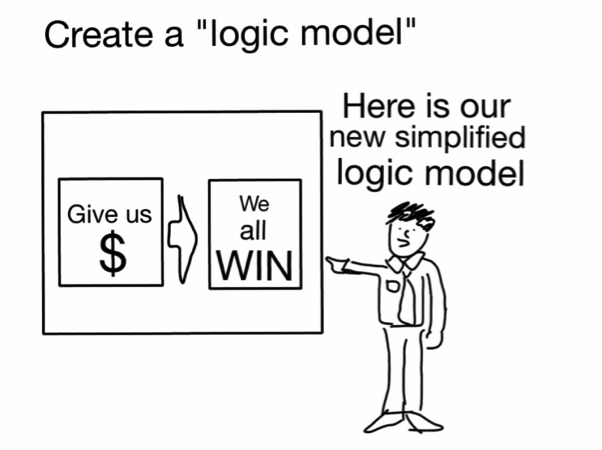
Hot Tip: Push the Limits. Cartoons give you a certain latitude to go over the top. When used wisely, pushing the limits can spark great discussion. Here is one of my early cartoons from a post on how to not really evaluate.
Do you have questions, concerns, kudos, or content to extend this aea365 contribution? Please add them in the comments section for this post on the aea365 webpage so that we may enrich our community of practice. Would you like to submit an aea365 Tip? Please send a note of interest to aea365@eval.org . aea365 is sponsored by the American Evaluation Association and provides a Tip-a-Day by and for evaluators.


Pingback: Data Discovery | Cognizeus
Pingback: Dayna Albert and Rochelle Zorzi on Evaluations that Make a Difference: Stories from Around the World · AEA365
Pingback: Big Data Club
What people might not know is you can actually hire Chris to do you a custom cartoon for your eval presentation. And he’s reasonable!
Shhhhhh, Kylie, we don’t want anyone to know I’m reasonable…
one picture is truly worth 1000 words! and can incorporate at least two of the 5Cs of technical writing (in your case, clarity and conciseness–maybe others)
Thanks Molly 🙂
I’d like to use the Logic Model cartoon in some of my in-house consultation. What needs to happen in regard to permissions, etc.?
JEStark
I hereby confer upon you the right to use my cartoons.
At some point I’m going to creative commons my cartoons, just haven’t gotten around to it as of yet.
Basically, as long as you’re not compiling them into a book and making a bunch of money, please use my cartoons freely.
Also, if anyone has figured out how to make a bunch of money off of my cartoons send me an email and let me know how you did it 🙂
I am completing my Ed.S. in Educational Leadership and Policy Studies, and am taking a program evaluation course. This really helped me make my paper about evaluation versus research MUCH more interesting! Thanks!
I’m glad Heather 😉
This is, by far, one of my favorite aea365 posts of all time. Thanks to Chris for leading our field forward and helping us think in new and creative ways.
Aww, what a really nice thing to say, thank you Ann 🙂