Introduction: I am Jennifer (Jenny) Cohen, community-organizer by training and program evaluator in practice, most recently in Israel and with projects designed to advance advocacy and policy change. Wearing several different hats, including for the last six years with Sikkuy, I facilitate evaluation capacity-building activities as an organizational management tool. Academic and field research increasingly reflects that when non-profit organizations systematically evaluate their work, they improve not only internal communications and planning, but also the outcomes and impact of their social change initiatives.
Lessons Learned: It is increasingly recognized that relatively simple efforts to understand the contribution that organizations make to social progress can lead to significantly more valuable findings and learnings than attempts to assign attribution to a specific stakeholder and/or intervention, especially in complex settings. A compelling example is where Jewish and Palestinian citizens of Israel, working as joint advocates to advance equality and shared society, seek to quantify the specific impacts of their own initiatives, alongside and/or isolated from the work of others. Innovative evaluation tools, implemented systematically, demonstrate that persistence pays off big time, even in the face of seemingly insurmountable barriers including limited resources and fears of criticism from all sides.
Hot Tips (or Cool Tricks):
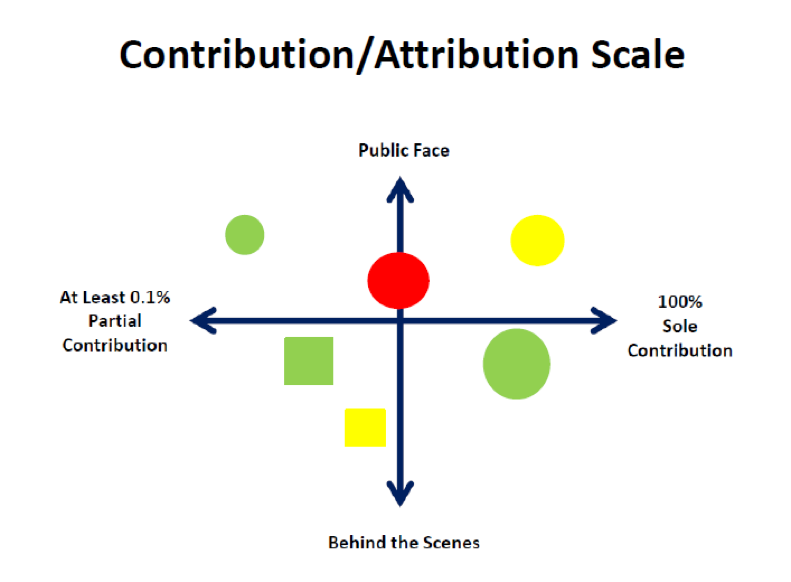
To help social change organizations use evaluation as a regular part of their work, I recently developed this “Contribution/Attribution Scale”, which clarifies the connections between different advocacy interventions, within and across projects, organizations, and sectors. It’s a simple tool that can be used proactively for planning and/or retroactively for mapping how different advocacy efforts influence a particular policy change.
- The (horizontal) X-axis shows the extent to which an intervention is employed cooperatively (towards the left) or individually by one stakeholder (towards the right).
- The (vertical) Y-axis refers to where an intervention takes place, either in the public eye or behind closed doors (an important consideration in complex policy change work).
- The colors symbolize an intervention’s understood impact as positive (green), harmful (red) or both positive and negative (yellow).
- The shapes represent different stakeholders (NGO X is round, Local Municipality Y is square), and the size of the shapes indicate the scope of the intervention, relative to others.
Most simply, the tool can be used for self-reporting by team members posting stickers on a board in a planning or mapping/data analysis session. With a bit more technological investment, self-reporting by multiple players can occur simultaneously through front-end data loading into a centralized bank, allowing for challenges to or triangulation of data. Foundations have begun to utilize this tool for mapping their grantee contributions in a targeted policy area.
Rad Resources: Mayne gets an earlier tip of my hat and Garner & Brindis the latest and no less grateful nod for their significant contributions to this critical conversation.
Do you have questions, concerns, kudos, or content to extend this aea365 contribution? Please add them in the comments section for this post on the aea365 webpage so that we may enrich our community of practice. Would you like to submit an aea365 Tip? Please send a note of interest to aea365@eval.org . aea365 is sponsored by the American Evaluation Association and provides a Tip-a-Day by and for evaluators.


Great invention Jenny!
I think the use of the term “partial” and “sole” contribution should be reviewed for more clarity.
Thank you very much!
Pingback: Consultancy: Rapid Attribution Analysis – Food and Agriculture Sector - Zambia Jobs
Pingback: Consultancy: Rapid Attribution Analysis – Tourism Sector - Zambia Jobs