I am Kate Goddard Rohrbaugh, an evaluator in the Office of Strategic Information, Research, and Planning at the Peace Corps in Washington, DC. Today I am writing about lessons learned when planning and executing a cross-sectional analysis from studies conducted in multiple countries, and I will provide some cool tricks for writing syntax.
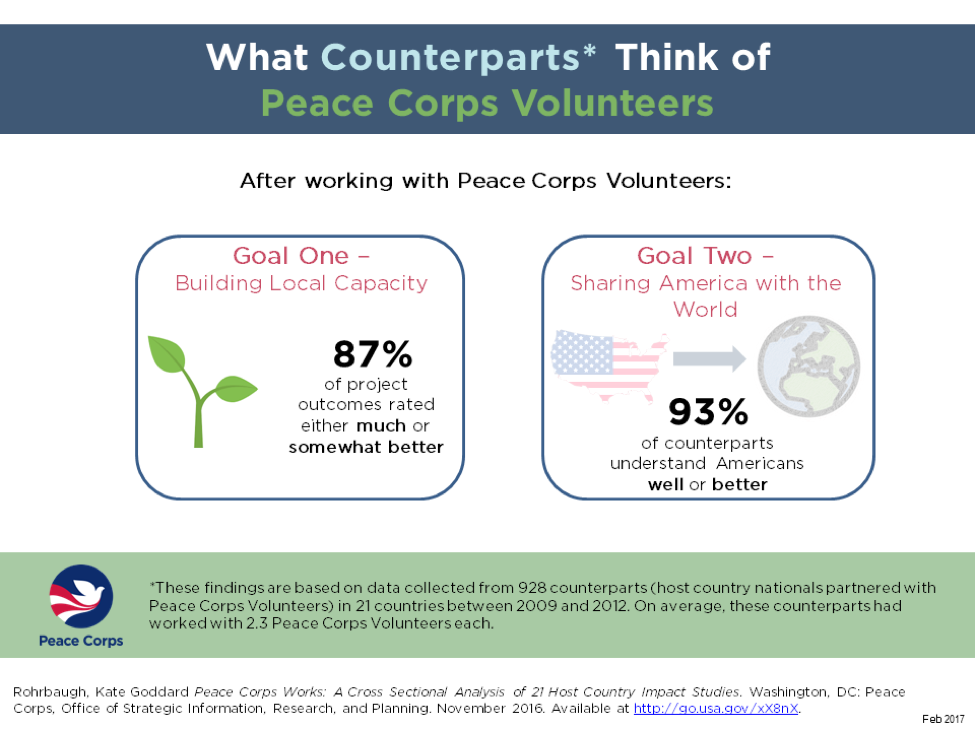
Between 2008 and 2012, the Peace Corps funded the Host Country Impact Studies in 24 countries. In 2016, the Peace Corps published a cross-sectional analysis of 21 of these discrete studies. An infographic summarizing some of the key findings is offered below. To download the entire study, go here.
The data for this study were collected by local researchers. Their assignment was to translate the standard data collection instruments provided by our office, work with staff at Peace Corps posts to add questions, collect the data, enter the data, report the findings, and submit the final products to our office.
Lessons Learned:
- Understand the parameters of your environment –
- The Peace Corps is budget conscious, thus studies were staggered so that the funding was spread out over several years.
- The agency is subject to a rule that limits employment for most to 5 years requiring excellent documentation.
- Pick your battles regarding consistency –
- Start with the big picture in mind and communicate that programmatic data are most valuable for an agency when reviewed cross-sectionally.
- Give your stakeholders some latitude, but establish some non-negotiables in terms of the wording of key questions, variable labels, variable values that are used, and the direction of the values (1=bad, 5=good).
- Use local researchers strategically –
- There are many pros to working with local researchers. As a third party, they can help reduce positivity bias, they have local knowledge, hiring locally builds good will, and it is less expensive than using non-local researchers.
- There are cons as well. There is less inter-rater reliability, a greater need to for quality control, and the capacity to report findings was found to be uneven.
- Enforce protocols for collecting end products –
- It is essential that the final datasets are collected and clearly named, along with the interview guides, reports, and codebooks.
Cool Tricks:
Merging multiple datasets with similar, but not always the same, variables is enormously challenging. To address these challenges, rely heavily on Excel for inventorying the data and creating syntax files in SPSS.
The most useful function for coding in Excel is “=CONCATENATE”. Using this command, you can write code for renaming variables, assigning labels, identifying missing values, assigning formats, and so on. For example, for formatting variables in SPSS:
- Your function would look like this:
- =CONCATENATE(“formats “,T992,” (f”,U992,”.0).”)
- But your SPSS syntax looks like this:
- formats varname1 (f1.0).
After creating a column of formulas for a series of data, you can just copy and paste the whole column into your syntax file, run, and save.
The American Evaluation Association is celebrating International and Cross-Cultural (ICCE) TIG Week with our colleagues in the International and Cross-Cultural Topical Interest Group. The contributions all this week to aea365 come from our ICCE TIG members. Do you have questions, concerns, kudos, or content to extend this aea365 contribution? Please add them in the comments section for this post on the aea365 webpage so that we may enrich our community of practice. Would you like to submit an aea365 Tip? Please send a note of interest to aea365@eval.org. aea365 is sponsored by the American Evaluation Association and provides a Tip-a-Day by and for evaluators.

