Hello, Erin M. Liang, Mark M. Holske, and Humberto Reynoso-Vallejo here, members of the research team evaluating the Health Care Cost Containment law (Chapter 224) from the Office of the State Auditor.
Using administrative data with a significant number of missing key variables (e.g. race/ethnicity) can be challenging in trying to answer specific evaluation questions. One of our research questions seeks to evaluate the impact of Chapter 224 on racial/ethnic disparities in health outcomes. Both administrative data sets available to us (the Massachusetts Medicaid Program (MassHealth) and the All Payer Claims Database (APCD)) have sparsely populated information about race and/or ethnicity. Since we were not able to apply imputation techniques due to the large number of missing values, we have to use alternative methods. As a proxy for race/ethnicity data, we used US Census Bureau Data and GIS mapping software.
Hot Tip: Use state level census data to account for missing racial/ethnic values. The US Census collects detailed race/ethnicity data at the state level every 10 years. Census data is publicly available on the American Fact Finder website. There are several data sets available, and this tool can aid in determining which data set best suits the needs of your project.
In this project, census data from 2010 will be applied to collected data spanning years 2006 to present, segmented by ZCTA (zip code tabulation area). Researchers should be aware that a zip code can be in more than one ZCTA. To learn about how zip codes are translated to ZCTAs, consult this census demonstration.
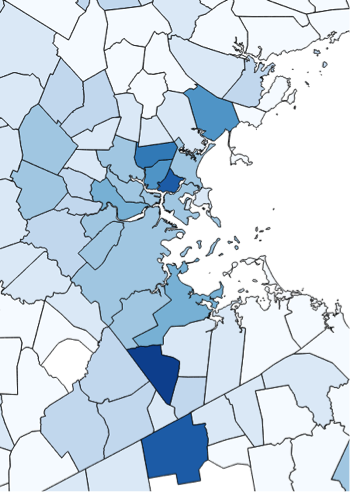
This map was made using QGIS and census data. The map is segmented by cities/towns with the darker areas representing populations with a higher percentage of diverse residents.
Rad Resource:
- The Census Bureau Help Line is 1-800-923-8282. A census representative can help to download the correct data.
- The American Community Survey provides annual demographic information at the state and county level.
- In addition to QGIS, a large project with sufficient funding could utilize Tableau, an easy to use data analysis tool that allows users to visualize data with graphs, cross-tabs, and maps. While these functions can be done in other tools like Excel or ArcMap, Tableau allows a user to create a dashboard containing all visualizations on the same page.
The American Evaluation Association is celebrating Large Scale Evaluation Week. The contributions all this week to aea365 come from evaluators who have worked on the evaluation of the Health Care Cost Containment Law in Massachusetts. Do you have questions, concerns, kudos, or content to extend this aea365 contribution? Please add them in the comments section for this post on the aea365 webpage so that we may enrich our community of practice. Would you like to submit an aea365 Tip? Please send a note of interest to aea365@eval.org. aea365 is sponsored by the American Evaluation Association and provides a Tip-a-Day by and for evaluators.

