I am Jeff Wasbes, a Senior Researcher and Project manager with Research Works, Inc., an independent evaluation consulting firm.
A simple and functionally useful tool for diagramming systems is the Causal Loop Diagram (CLD). CLDs have been applied in nearly every conceivable discipline because by just using some very basic elements, one can describe the interactions within very complex systems. They are particularly useful for conveying a hypothesis about the causes of the dynamics within a system, eliciting or capturing the mental models of an individual or a group, and for communicating the important endogenous feedback structures might be responsible for a problem.
Hot Tip: What are CLDs good for? Structure dictates behavior. If a change in behavior is desired, then a change in structure is required. CLDs help to explicate what you, your colleagues and other stakeholders understand about the structure and interactions that occur within a system.
Hot Tip: It is often easy to identify the observable and objective “hard” variables, but CLDs usually also include “soft” variables (we might also call them latent factors) that may lurk beneath the surface, often going undetected or unmeasured. Maybe it’s not possible to measure them, but they still may play an important role in the dynamic behavior of a system. Soft variables might be things like perceptions, attitudes, or beliefs.
Hot Tip: Links between variables in a CLD show causality, not correlation. Every causal link has a polarity, which is unambiguous. Link polarity works like this:
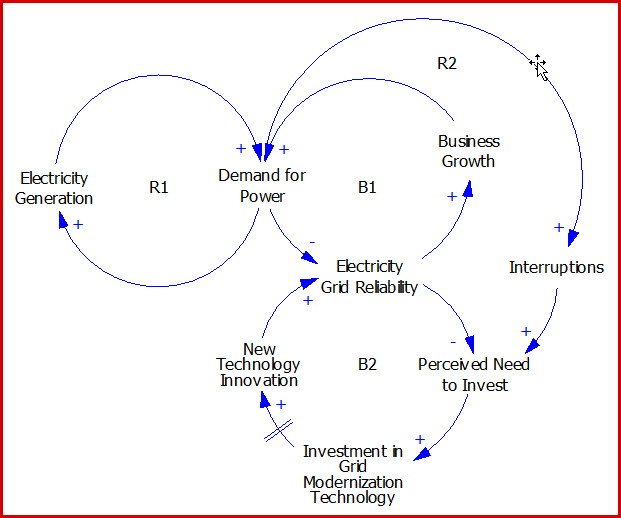
These interactions can be traced around feedback loops like those included in the following CLD:
Each feedback loop has a polarity characteristic. To reveal the polarity of a loop, “break” the loop at any chosen point and follow the interactions around the path. Note the direction o fthe resulting resulting change when you arrive at the selected break point.
Want to learn more?
Rad Resource: Sterman, John D. (2000). Business Dynamics: Systems Thinking and Modeling for a Complex World. Boston: McGraw Hill. This book is a tome, but it provides a comprehensive overview of system dynamics and contains great detail about causal loop diagrams. Most of the information for this post is attributable to Dr. Sterman.
Rad Resource: Richardson, George P. (1986). Problems with Causal Loop Diagrams. System Dynamics Review , 158-170. Dr. Richardson provides some important cautions about potential misuse of this qualitative tool.
This contribution is from the aea365 Tip-a-Day Alerts, by and for evaluators, from the American Evaluation Association. Please consider contributing – send a note of interest to aea365@eval.org. Want to learn more from Jef? He’ll be presenting as part of the Evaluation 2011 Conference Program, November 2-5 in Anaheim, California.


a similar principle for any system such as the complexity of the food system and different drivers and how they can communicate challenges in the food supply chain.
As it’s drawn, B1 and B2 combine to create a reinforcing loop. Taken with R1 and R2, this system can only generate growth. Perhaps that is what is intended? (The delay will act as a brake for a while, but it only slows the growth rate and doesn’t introduce interesting dynamics.)
Jeff,
I wish to use you great causal loop diagram as a figure in a chapter on “Causal Diagrams” in a new book I am completing for McGraw-Hill on Engineering Problem-solving 101: Timeless & Time-tested Techniques.
Kindly contact me so we can discuss.
Bob Messler
Thanks for the kind words, Matt. I believe there is much to learn from taking a ‘big picture’ and (more importantly) endogenous point of view of programs and policies.
I am going to LA in November. Looking forward to seeing you there! And I’ll be talking in greater detail about Causal Loop Diagrams on Friday at 1:35 in California A.
Thanks Jeff. As always, you’ve made another fantastic contribution to start and perpetuate the conversation around approaches to embracing and navigating the lives and environs of our programs and policies. Thank you. Going to LA in November?