Hi, my name is Lacie Barber and I am the Statistics Counselor at Smith College in the Spinelli Center for Quantitative Learning. I have a Ph.D. in Industrial-Organizational Psychology and a minor in Research Methodology.
Many researchers and practitioners work hard to develop and/or select psychometrically sound quantitative measures for their projects. Unfortunately, less attention is paid to monitoring and evaluating the quality of the data before conducting statistical analyses. This is rooted in several questionable assumptions: That all respondents completed the survey in a distraction-free environment, read and understood all instructions and items, and were not motivated to complete the survey quickly due to time constraints, incentives, or lack of enthusiasm for the project. By incorporating various quality control checks into your survey, you can create a priori rules for dropping certain cases from analysis that may be obscuring data trends and significant effects.
Hot Tip: Quality control checks are especially important for online surveys that are completed anonymously and/or have an incentive for completion. There is a higher propensity for individuals to haphazardly complete surveys when there is an incentive involved.
Cool Trick: In an online survey, outline important factors associated with data integrity (e.g., setting, careful reading) and give them the option to return later to complete the study or not to participate. For program evaluations, remind participants why their responses are valuable and how you will use the results to improve the program and/or organization.
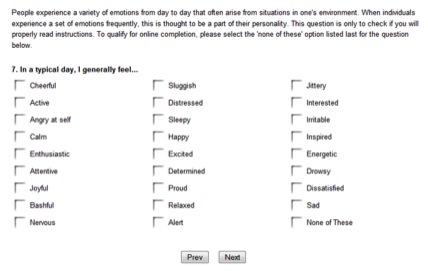
Cool Trick: Early in an online survey, create a disqualification item based on following instructions. See below for an example:
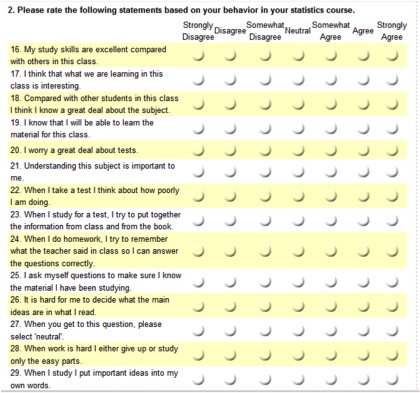
Cool Trick: Create several quality control items embedded within a long list of items containing similar response options. Missing multiple items provides rationale for dropping a certain respondent’s scores. See below for an example:
Cool Trick: Pick an online survey platform that allows you to record completion time. Isolate completion times two or three standard deviations below the mean to see if they differ significantly from the other respondents. The reliability of measures may also be lower in these participants compared to the rest.
Cool Trick: Repeat a question later in the survey that was asked earlier. For questions with Likert scales, you can create a “consistency score” by subtracting one item from the other. Responses farther from the mean may indicate random or careless responding.
Hot Tip: Cross-tabulate responses on two quality control checks to evaluate grounds for case deletion. I have dropped responses from my analyses that fell more than three standard deviations below the mean on time AND had inconsistency scores beyond three standard deviations from the mean, because I found a significant association between shorter completion time and consistency in my preliminary analyses.
This contribution is from the aea365 Tip-a-Day Alerts, by and for evaluators, from the American Evaluation Association. Please consider contributing – send a note of interest to aea365@eval.org.


Hi Lacie, great post.
Johanna as per your question, I would suggest you to either opt for survey monkey or sogosurvey, both offer amazing features. Survey monkey provides timestamps for open-ended responses and the latter helps to set timers for your survey. I have been using sogosurvey for a while now and I’m well pleased with the packages they offer and great customer support as well.
Some good tips in here, and I agree that people underestimate both the importance of data cleaning AND the presence of measurement error (much of which can’t be found by data cleaning by the way). I preach these two gospels almost daily 🙂 A couple points of feedback and clarification…
1) You build your post around the thesis that some statistical practices are “…rooted in several questionable assumptions,” but then going to say things that sound to me like they are also built on questionable assumptions, like “There is a higher propensity for individuals to haphazardly complete surveys when there is an incentive involved.” Can you cite one study that supports this? Do you include all survey modes (e.g., mail, phone,FTF) in this statement or just web surveys. There are many reasons respondents do not fully process questions or answer incompletely or quickly. In my experience (and from the research I know), most of those reasons are mode or design choices made by the researcher, such bad question wording, bad response options, or bad visual formatting (see point 2), but I don’t know of research that points to incentives as a clear cause of measurement error. I’d be happy to add those cites to my library if there are any. On the other hand, incentives have a major positive impact on response rate, which helps improve representativeness of the respondent pool and overall results. So be careful about advising people NOT to use incentives. Measurement error is only one piece of the puzzle. See work by Eleanor Singer and Robert Groves.
2) You show a grid format. There is ample evidence that grid formats in self-admin surveys inflate alphas for the scales contained within the grid because they cause respondents to satisfice or “straight line” (i.e., choose all the same option for all questions in the grid). You have some “cool tips” about how to work with grids to improve data quality, but don’t forget mention that piece of advice. References available upon request, but look at Jon Krosnick’s or Andy Peytchev’s work for some.
Happy Surveying! 🙂
Johanna & Lacie,
SurveyGizmo (who has been at AEA the past 2 years) also provides a start and finish timestamp with each response, available not only when viewing online, but also as part of the excel or csv exports.
Furthermore, we have additional options for recording the number of seconds a respondent spends on a particular page. This can be done by clicking ADD ACTION > Hidden Value, and choosing the Advanced Value for ‘page timer’. It can be added to any page where this is useful.
** Full disclosure, I am the Technical Training Manager at SurveyGizmo **
You are quite welcome, Marcus; good luck!
Hi Joanne! My favorite software is SurveyMonkey because it gives you the start time and finish time for each survey (which can be easily converted to completion times in Excel).
Additionally, SurveyMonkey has timestamps for open-ended responses, so sometimes I use them to gauge how much time respondents spend reading a certain page by having them type “OK” in a box on the page before reading the text (right before clicking Next Page) and then at the bottom of the page after reading the text (again, before clicking Next Page). I think both of these functions are important to ask about (or research) before purchasing any online survey package.
Hi Lacie,
Thanks for the insightful post! I plan to follow your advice and do something similar for an upcoming scale validation…
Hi Lacie, thanks for your post! Do you know which of the online survey software packages include the feature of completion time?